AGRONIX
precision agriculture software
From tractor to drone, the whole farm in a single app.
Agronix turns drone surveys and satellite imagery into vigour maps, variable-rate prescriptions and spray records. It runs in the browser, on computer, tablet and phone.
- Centimetre maps from the drone and satellite vigour between surveys
- Prescriptions ready for the spraying drone and for tractor terminals
- Spray records and field logbook always up to date
A complete platform for the farm
- 9
- vegetation indices from every multispectral survey
- 35
- AI models for diseases and pests of Italian crops
- 8
- formats for the spraying drone and tractor terminals
- 17,000+
- plant protection products from the Italian Ministry of Health database
Features
One app to run the farm
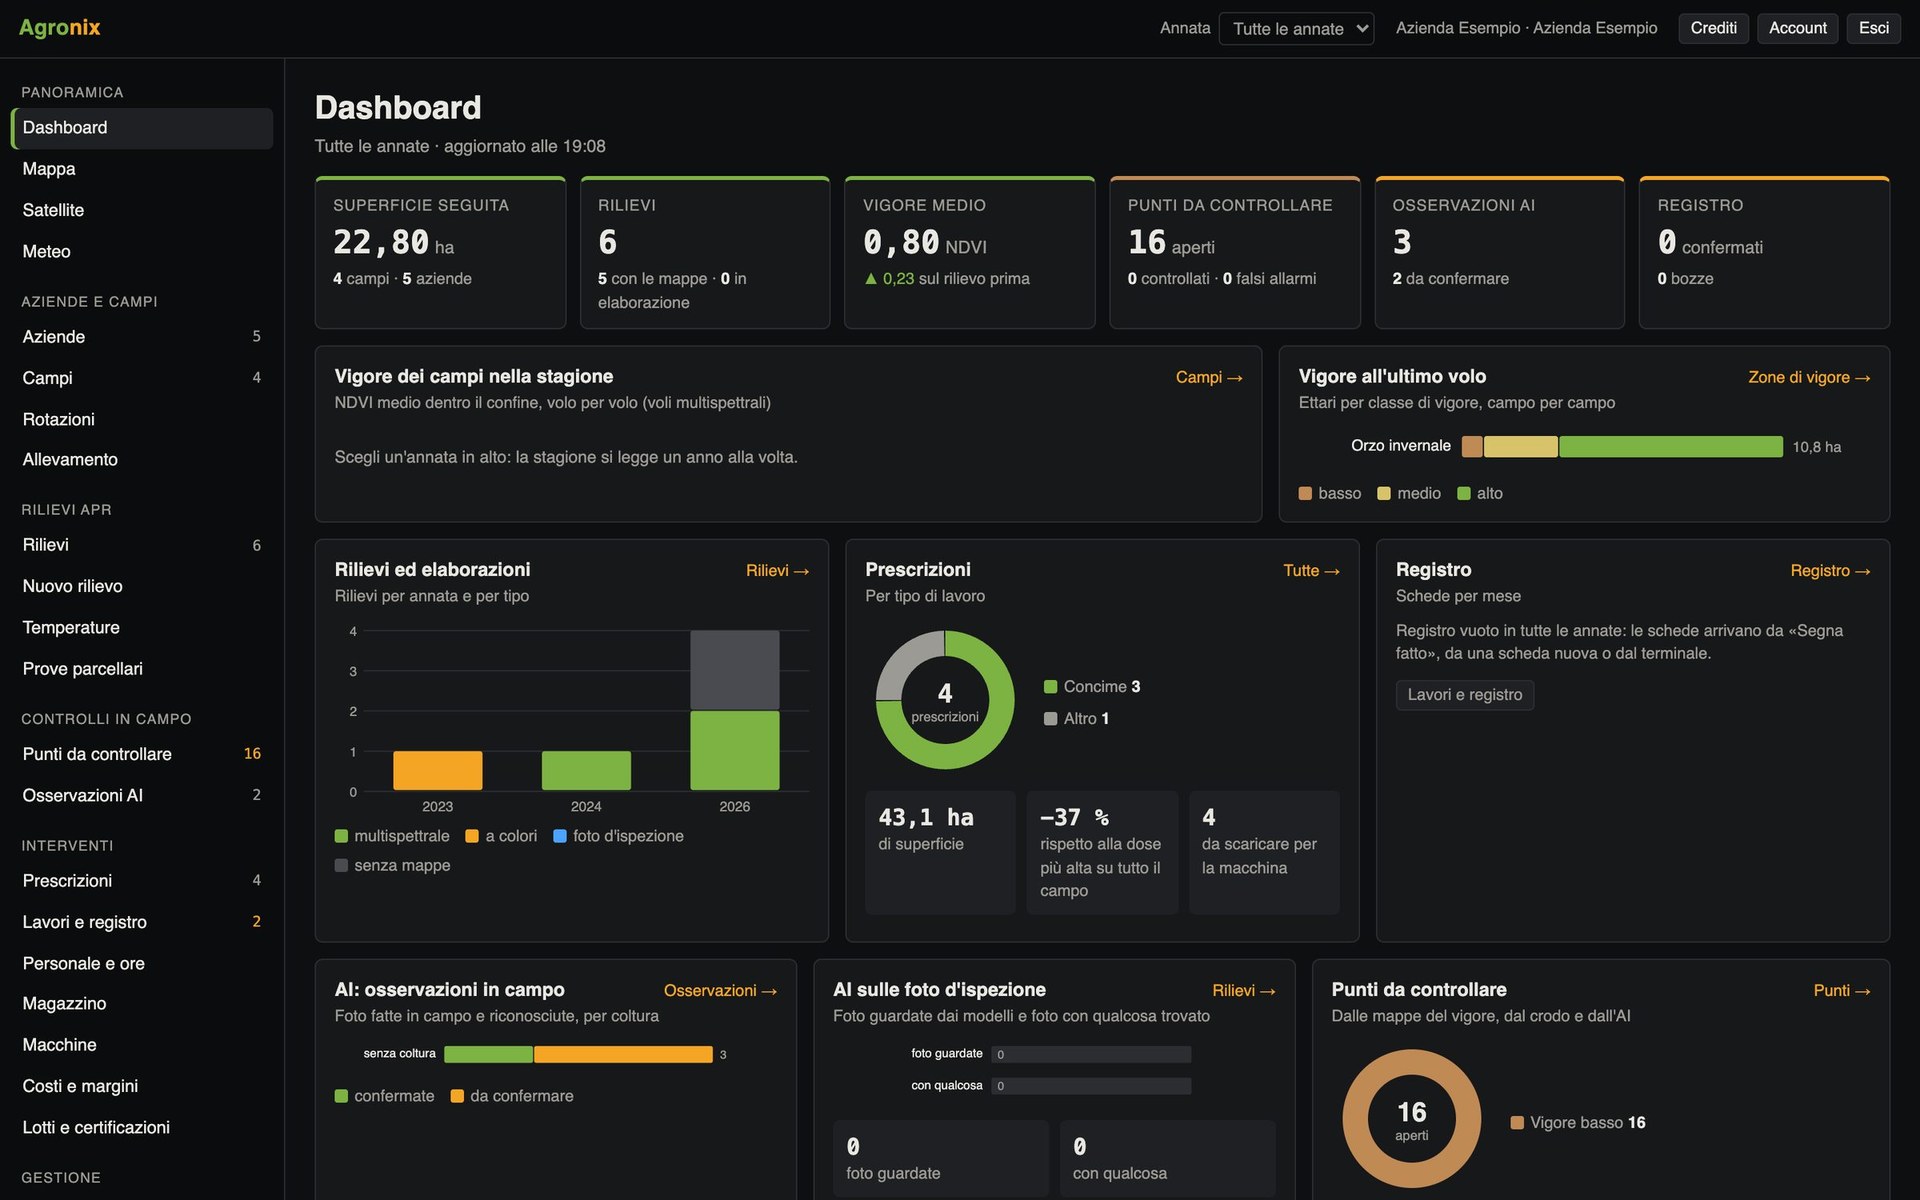
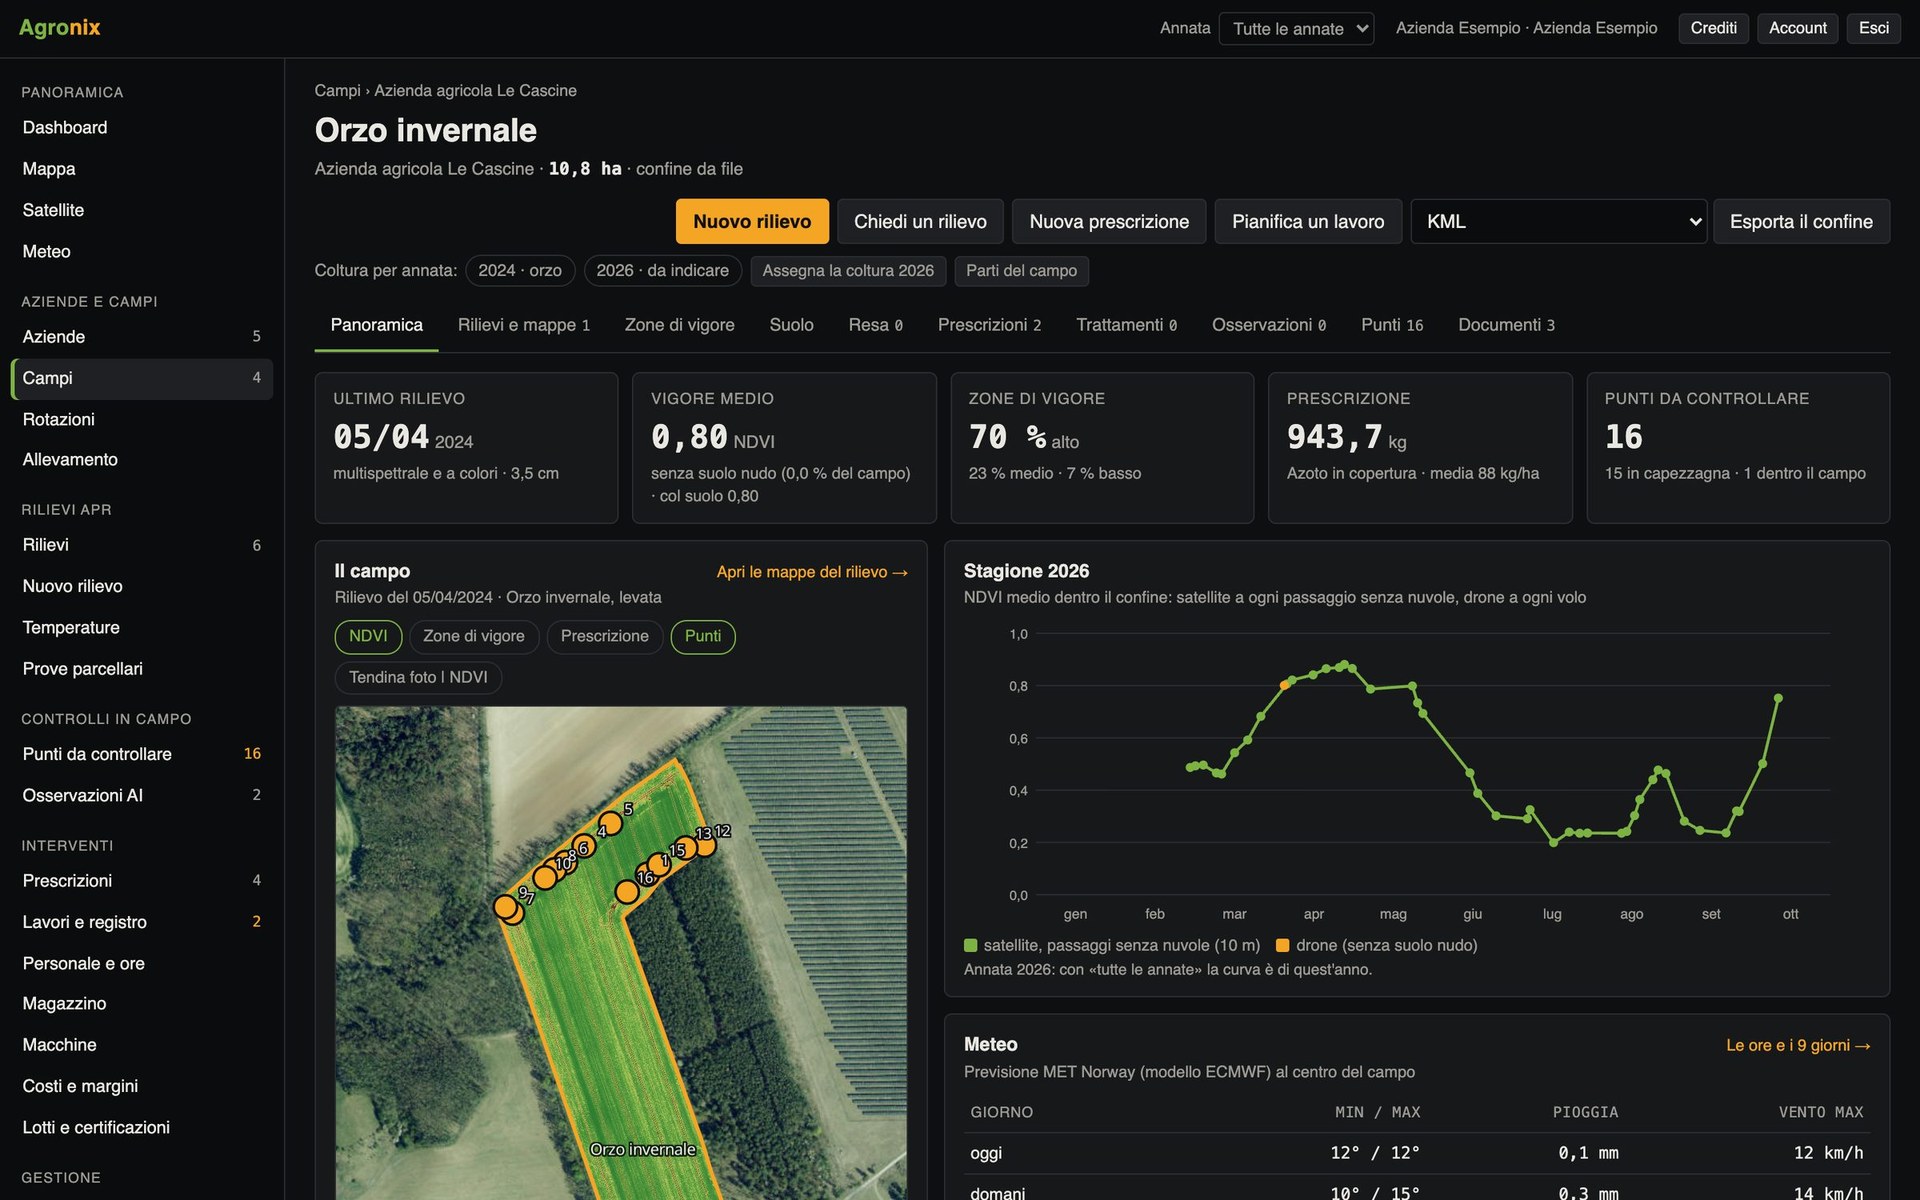
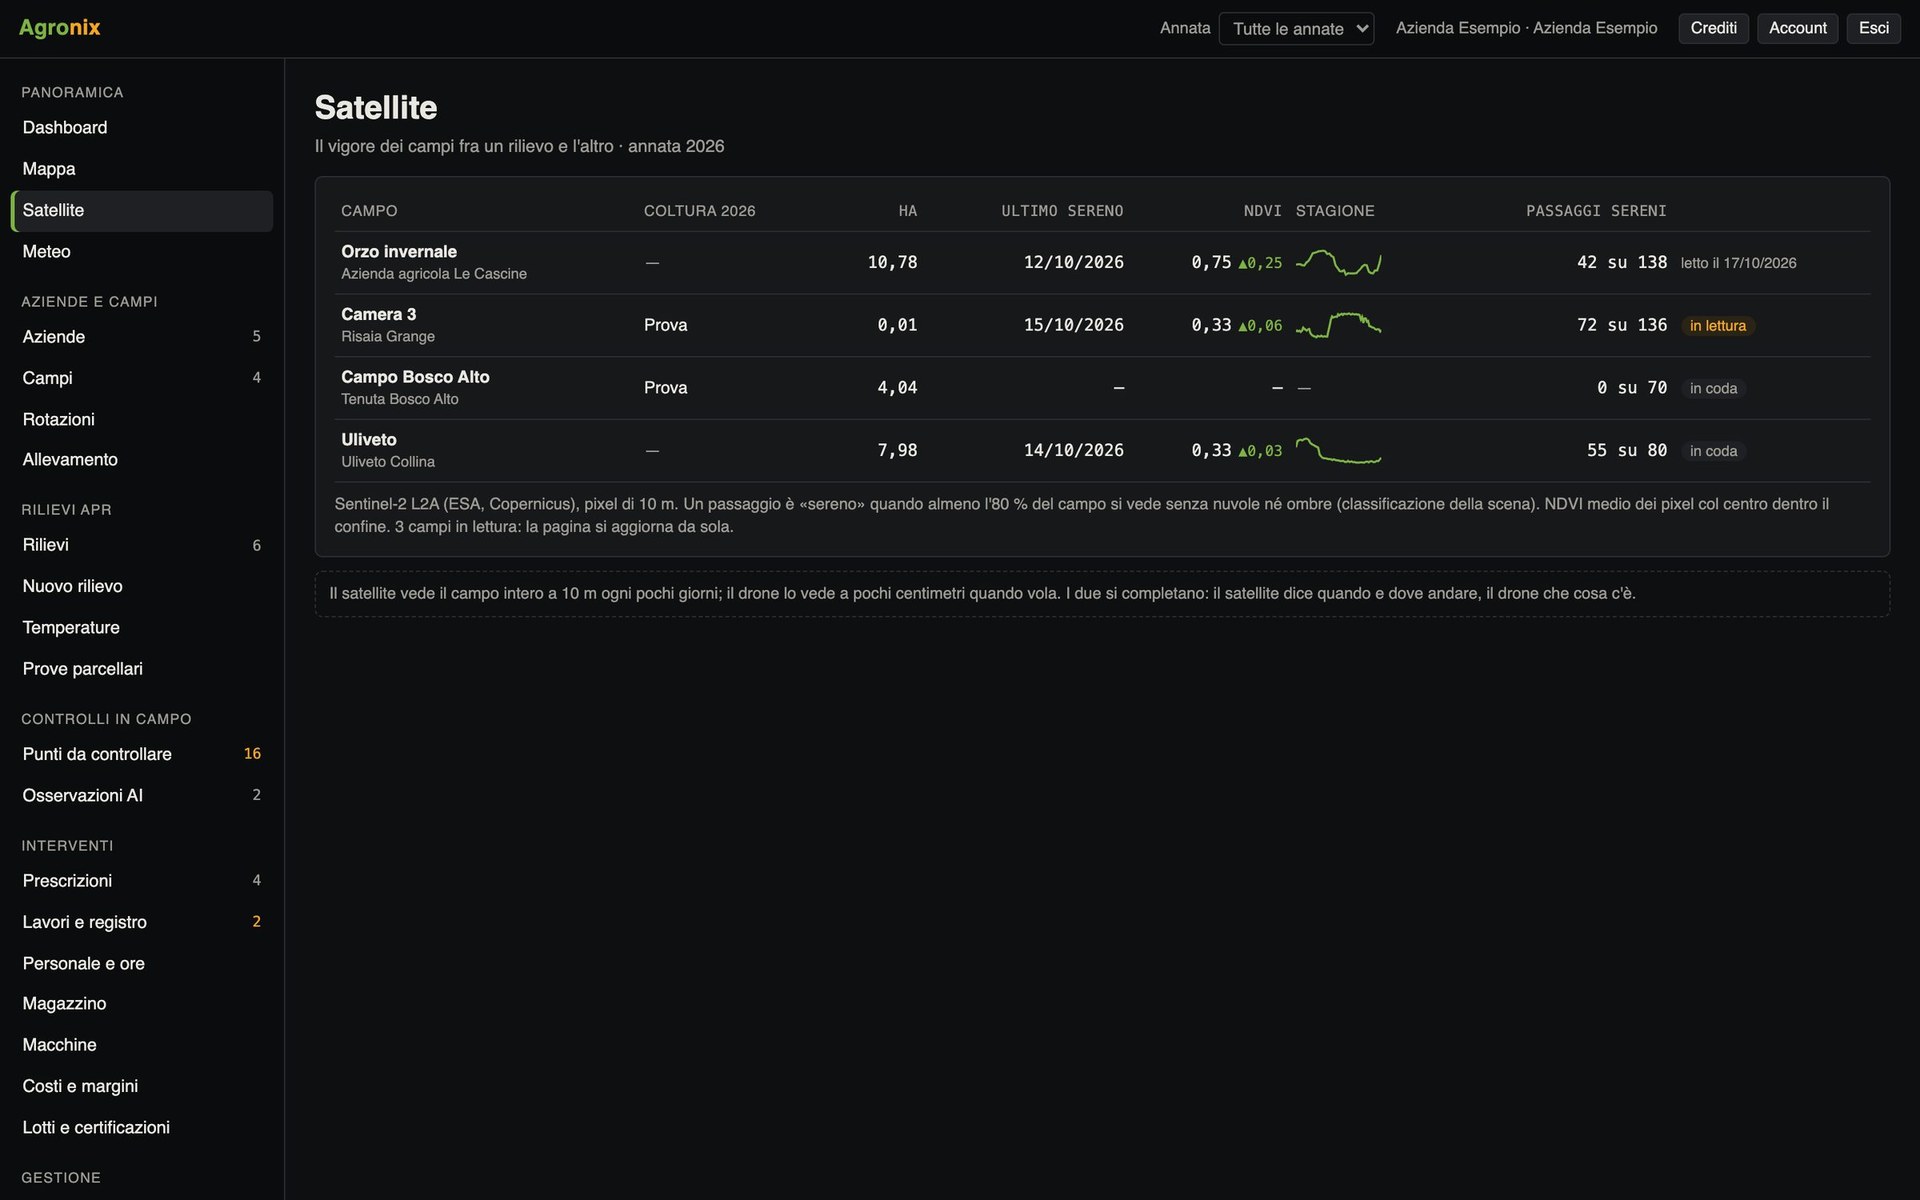
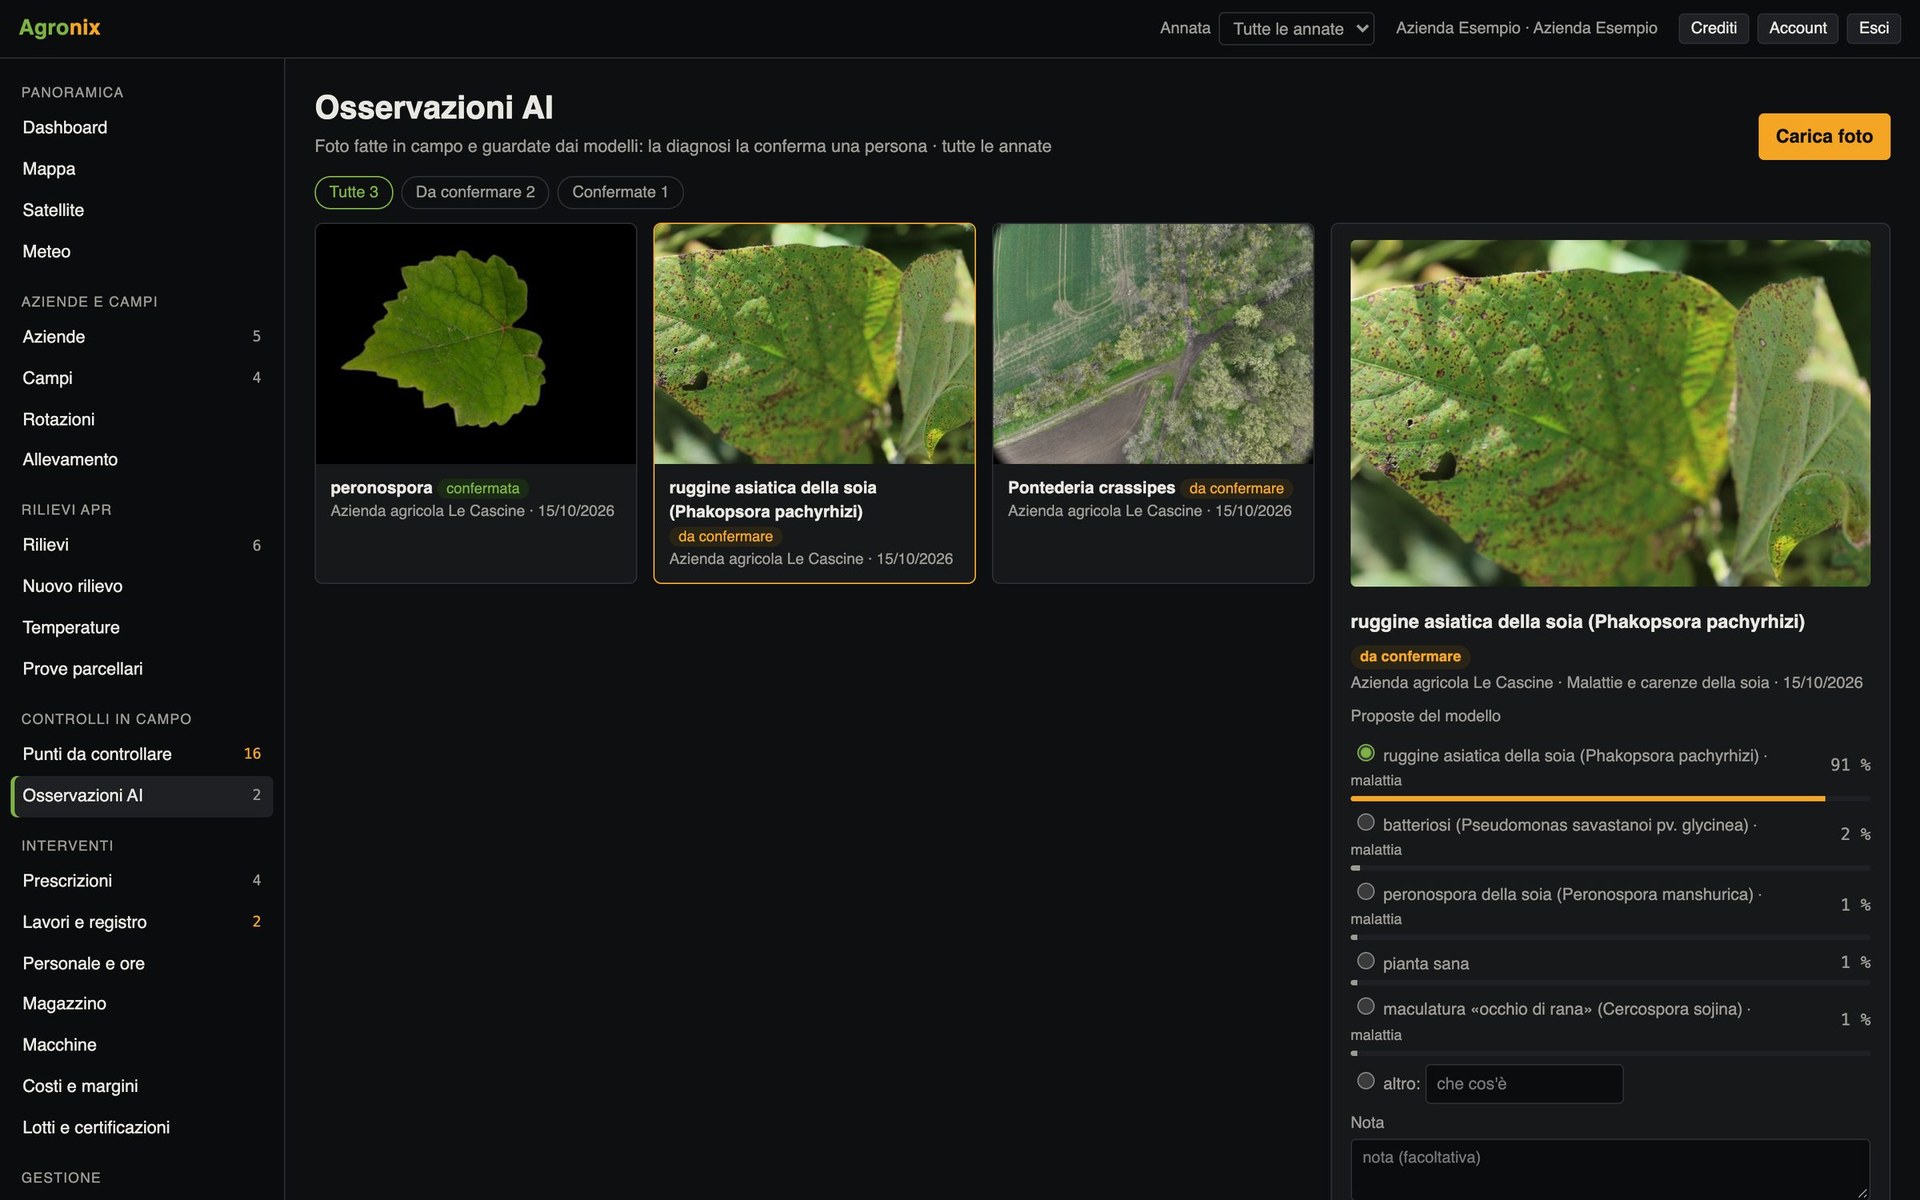
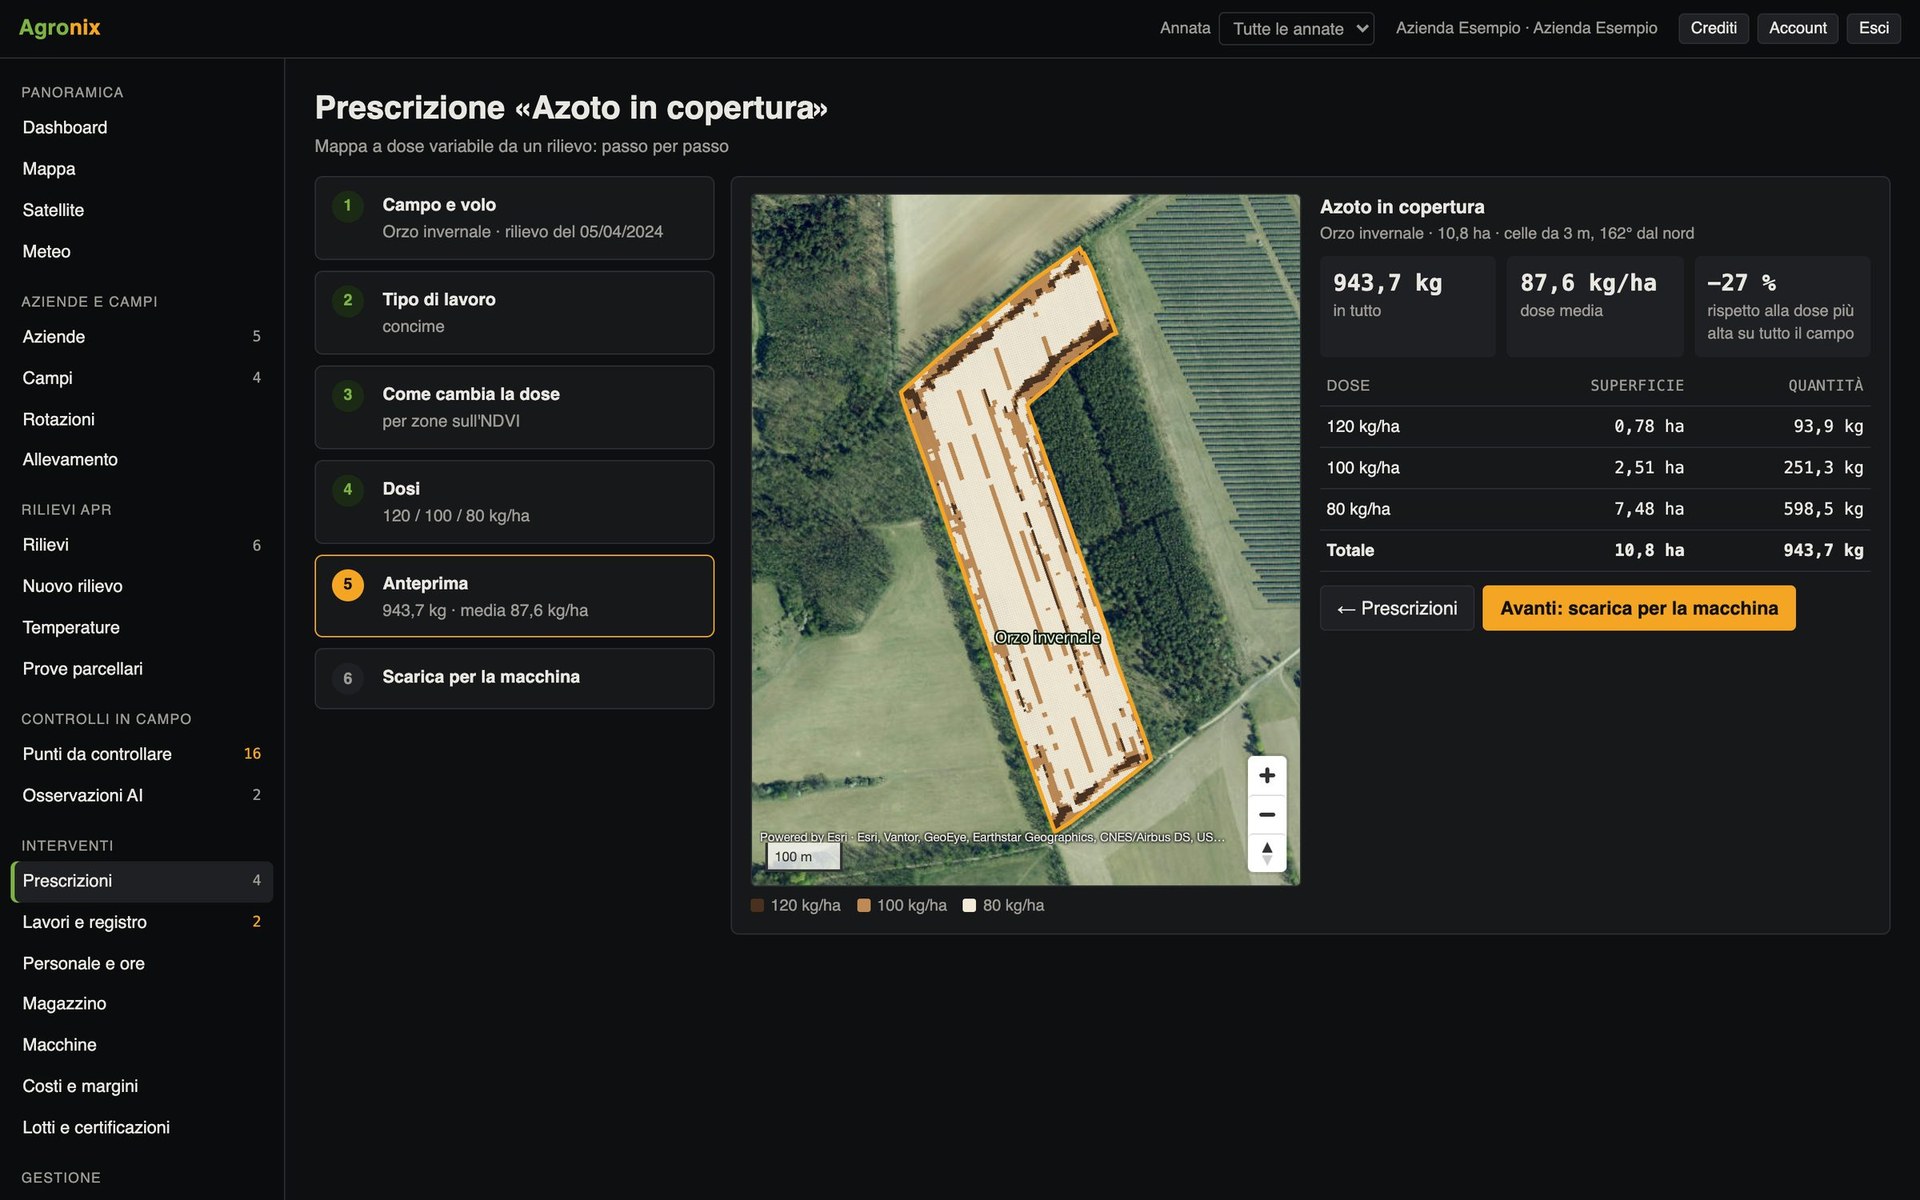
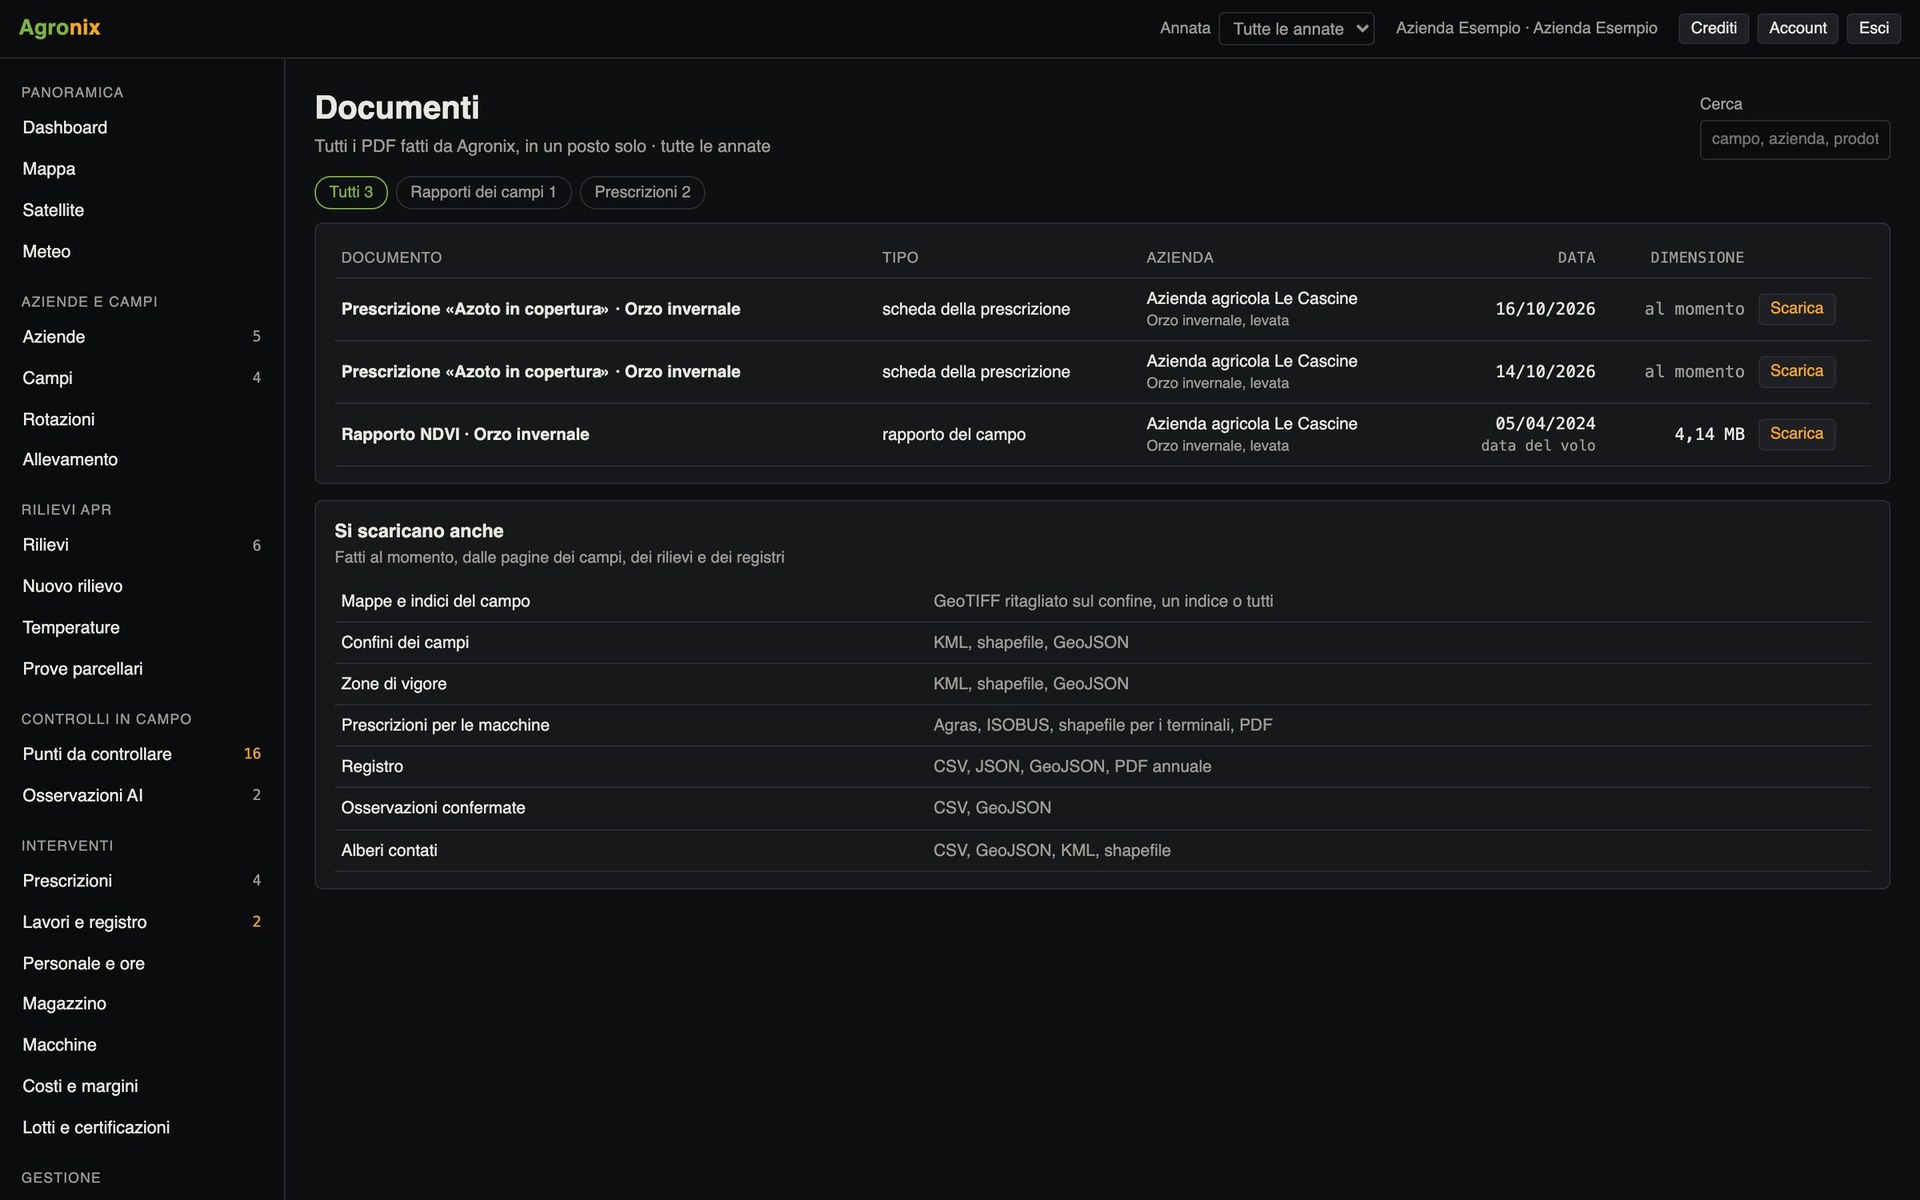
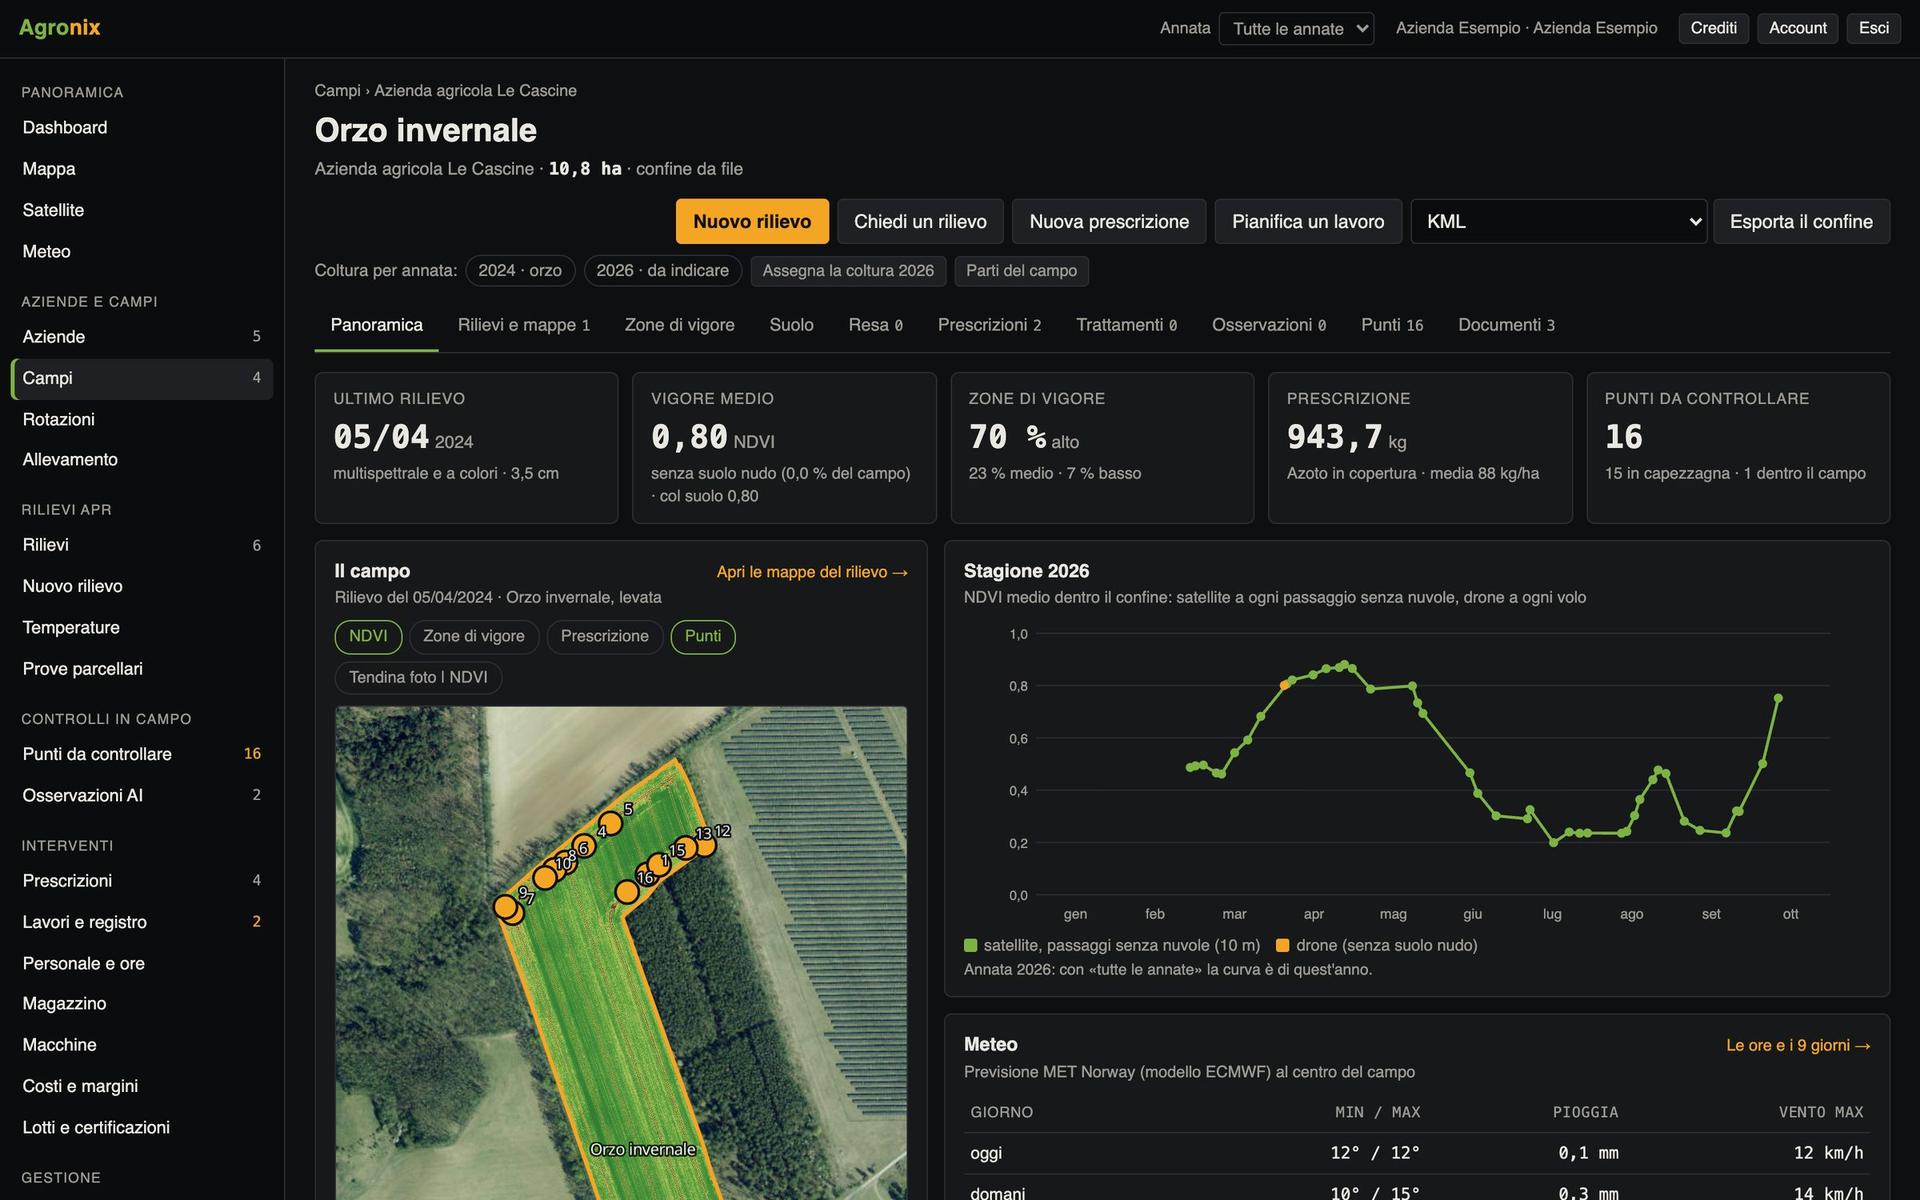
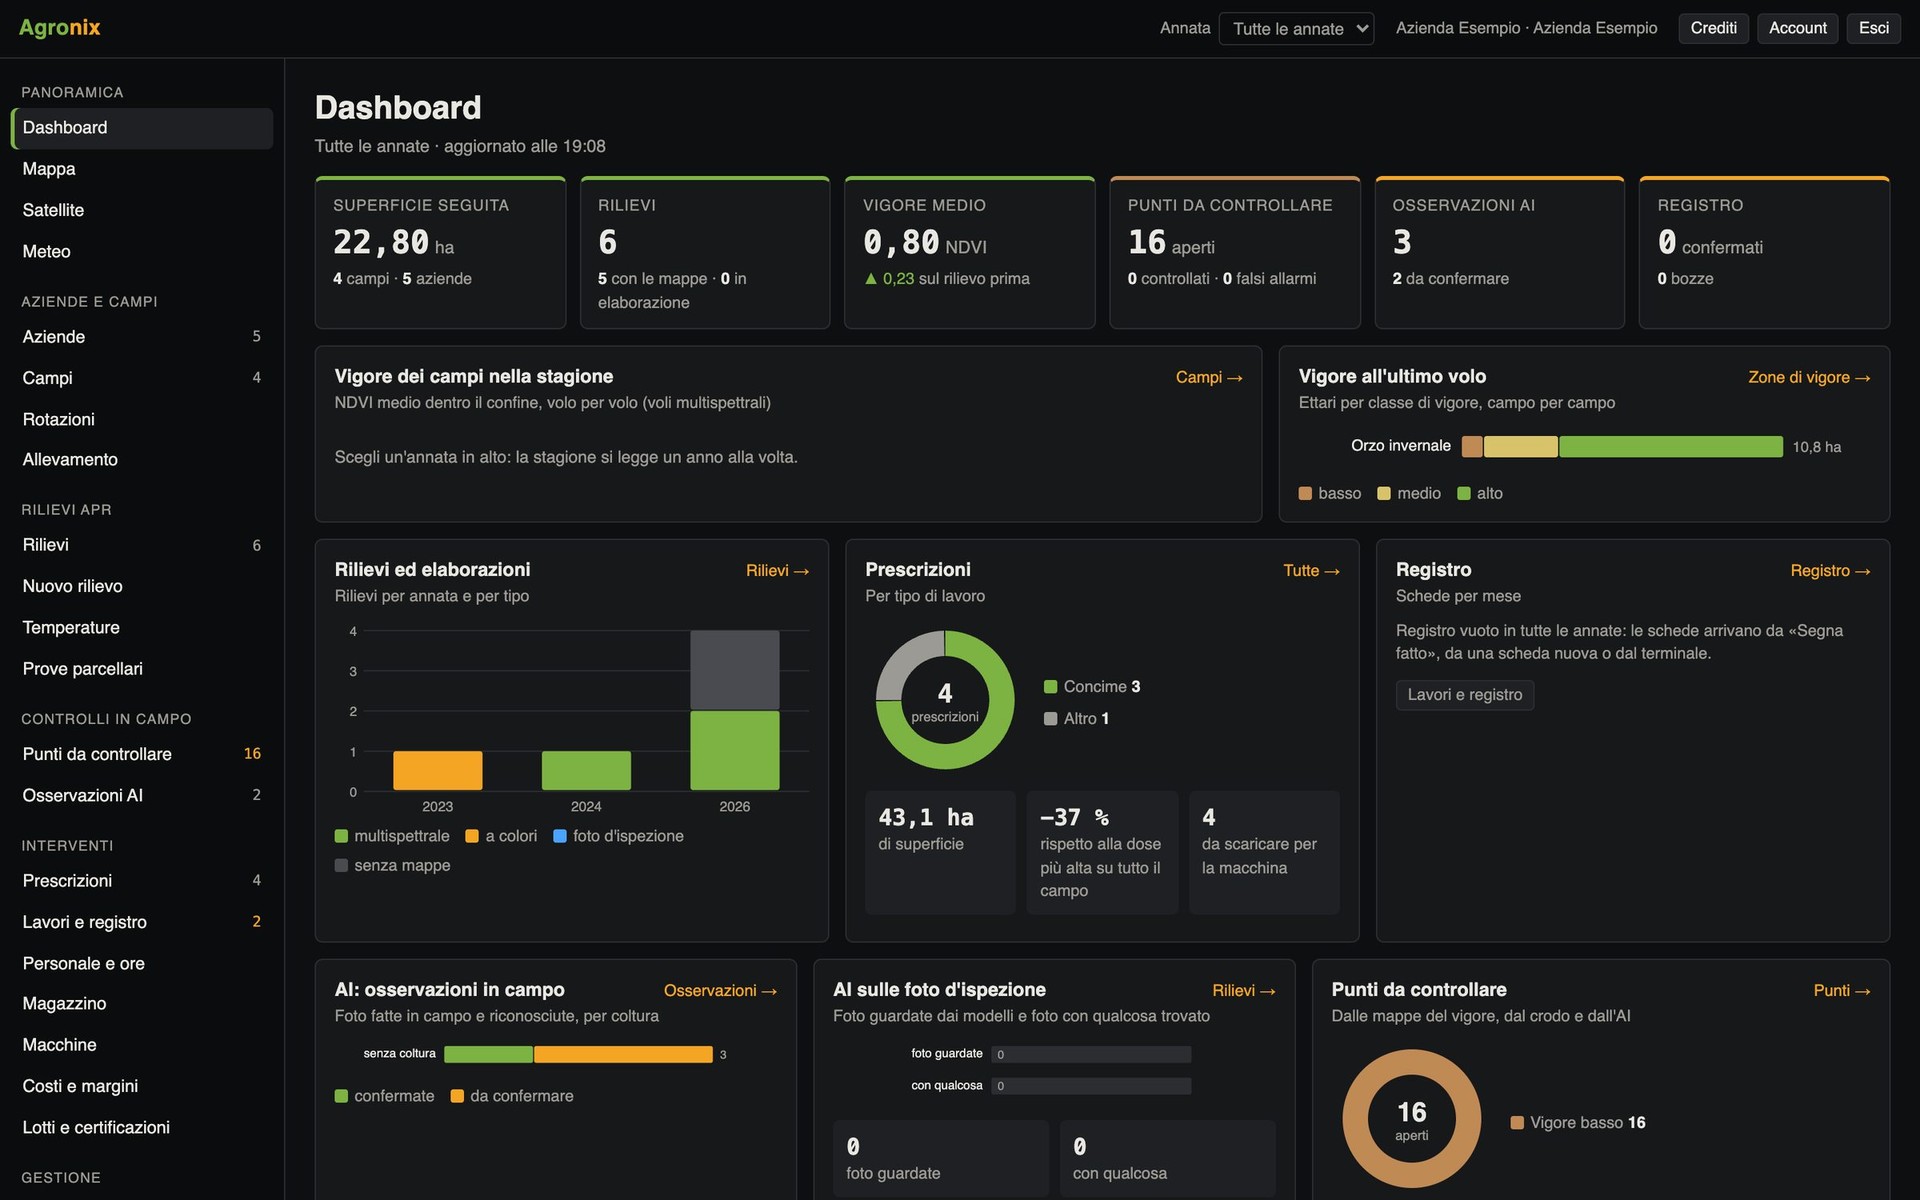
Area managed, average vigour, surveys, prescriptions, points to check and the season's records on one screen.
Screens with example data.
Drone surveys
From flight to field map
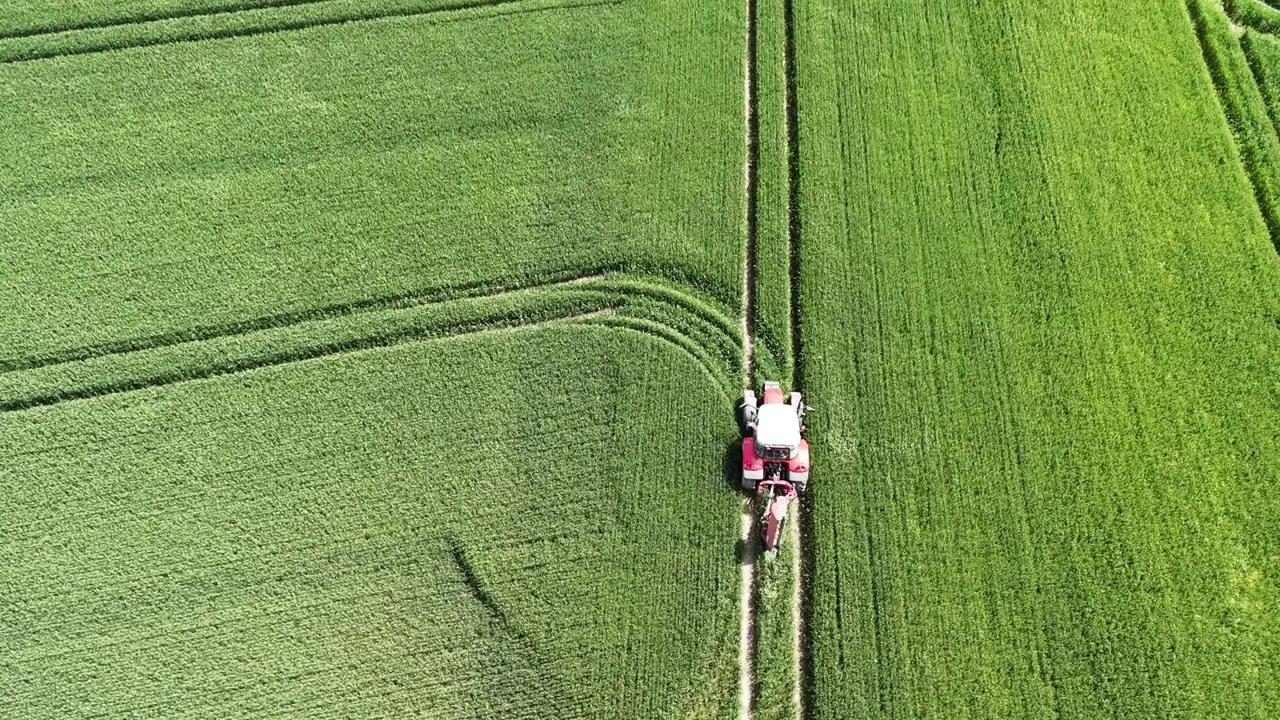
The drone sees the field to the centimetre. Agronix plans the flight, checks the photos and returns measurable maps.
Plan the survey on the field boundary
Pick the field and Agronix works out altitude, overlaps and flight lines for the multispectral drone and prepares the file for the remote controller. Then upload the photos and the server does the rest.
- Automatic check of bands, shots and calibration panel
- Processing on our servers in Europe
- Maps ready with statistics for every field
Compare photo and index with the slider
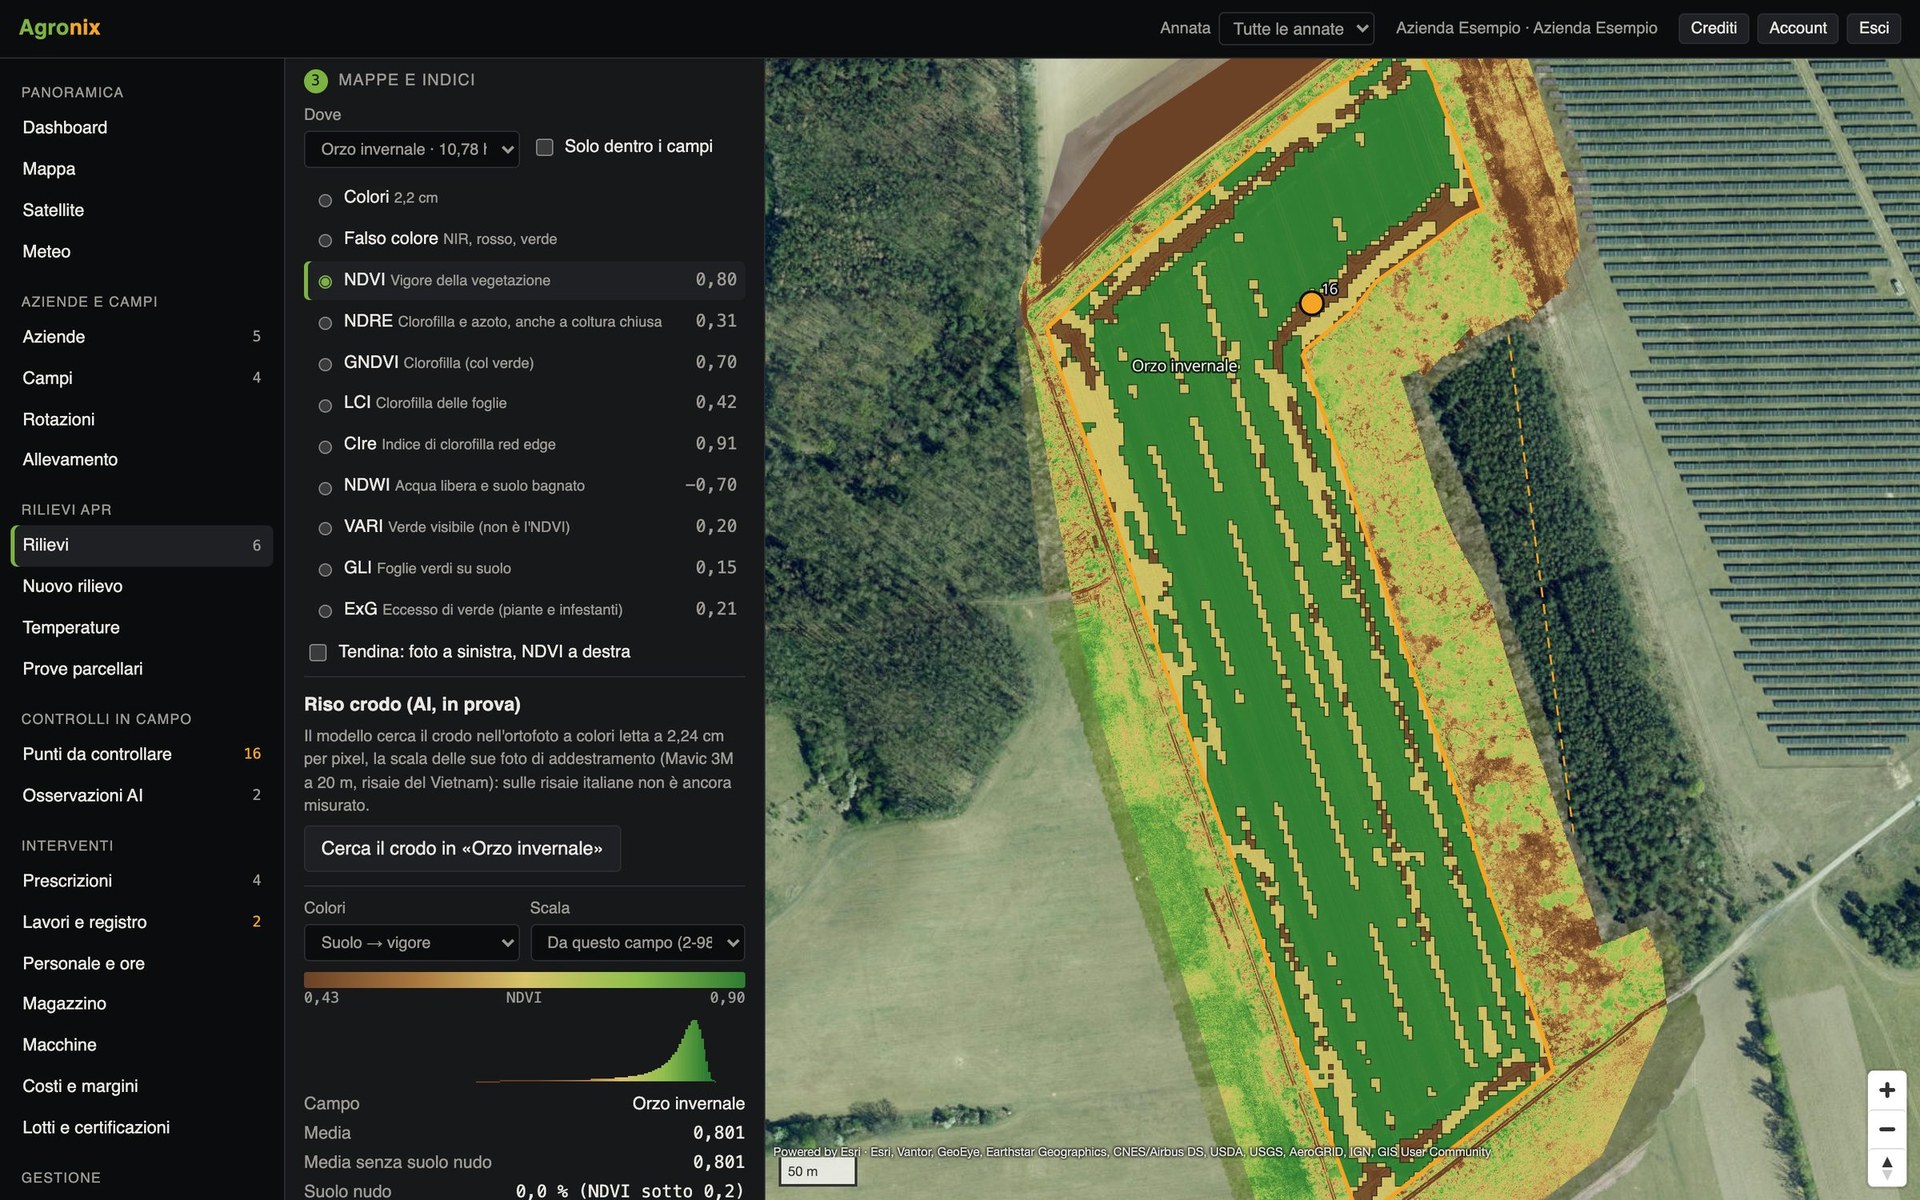
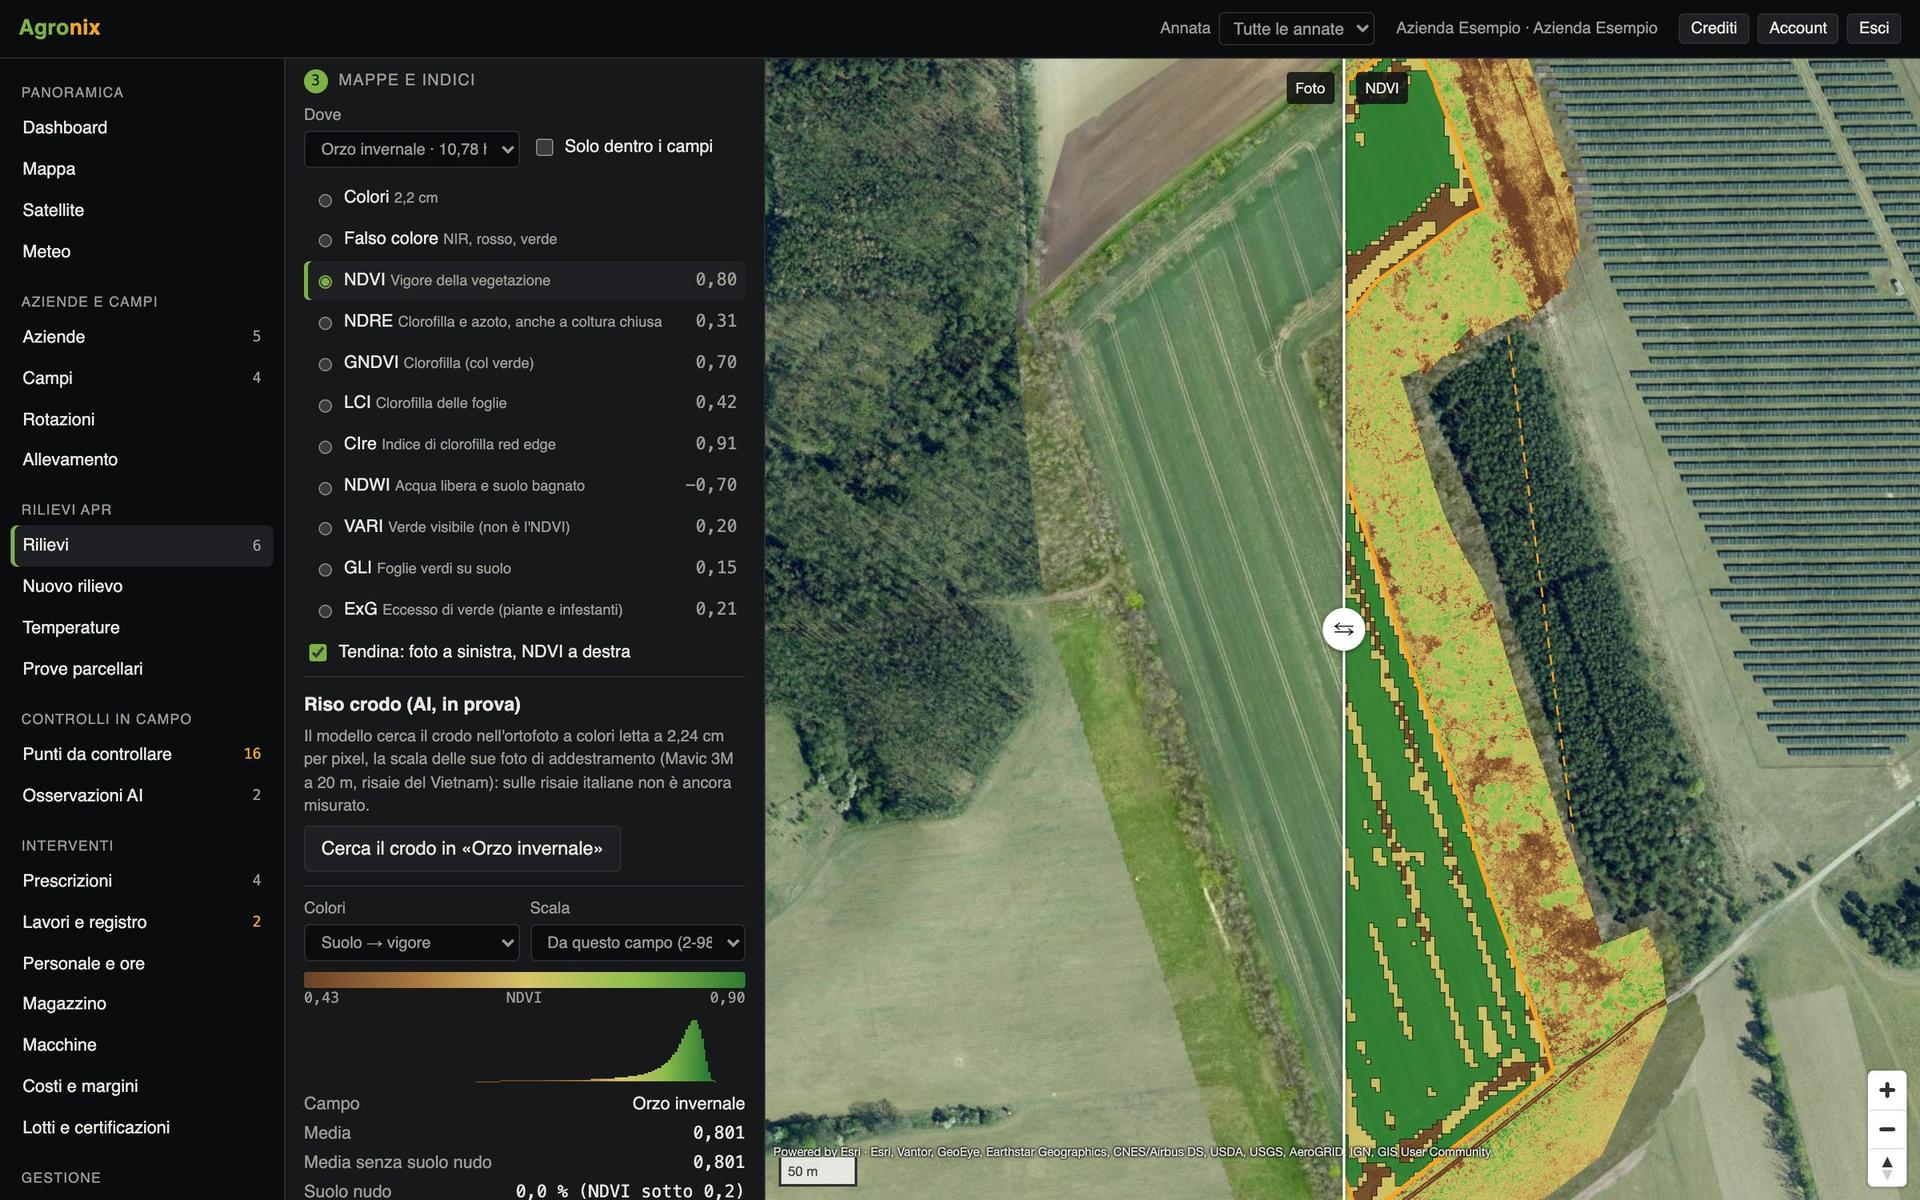
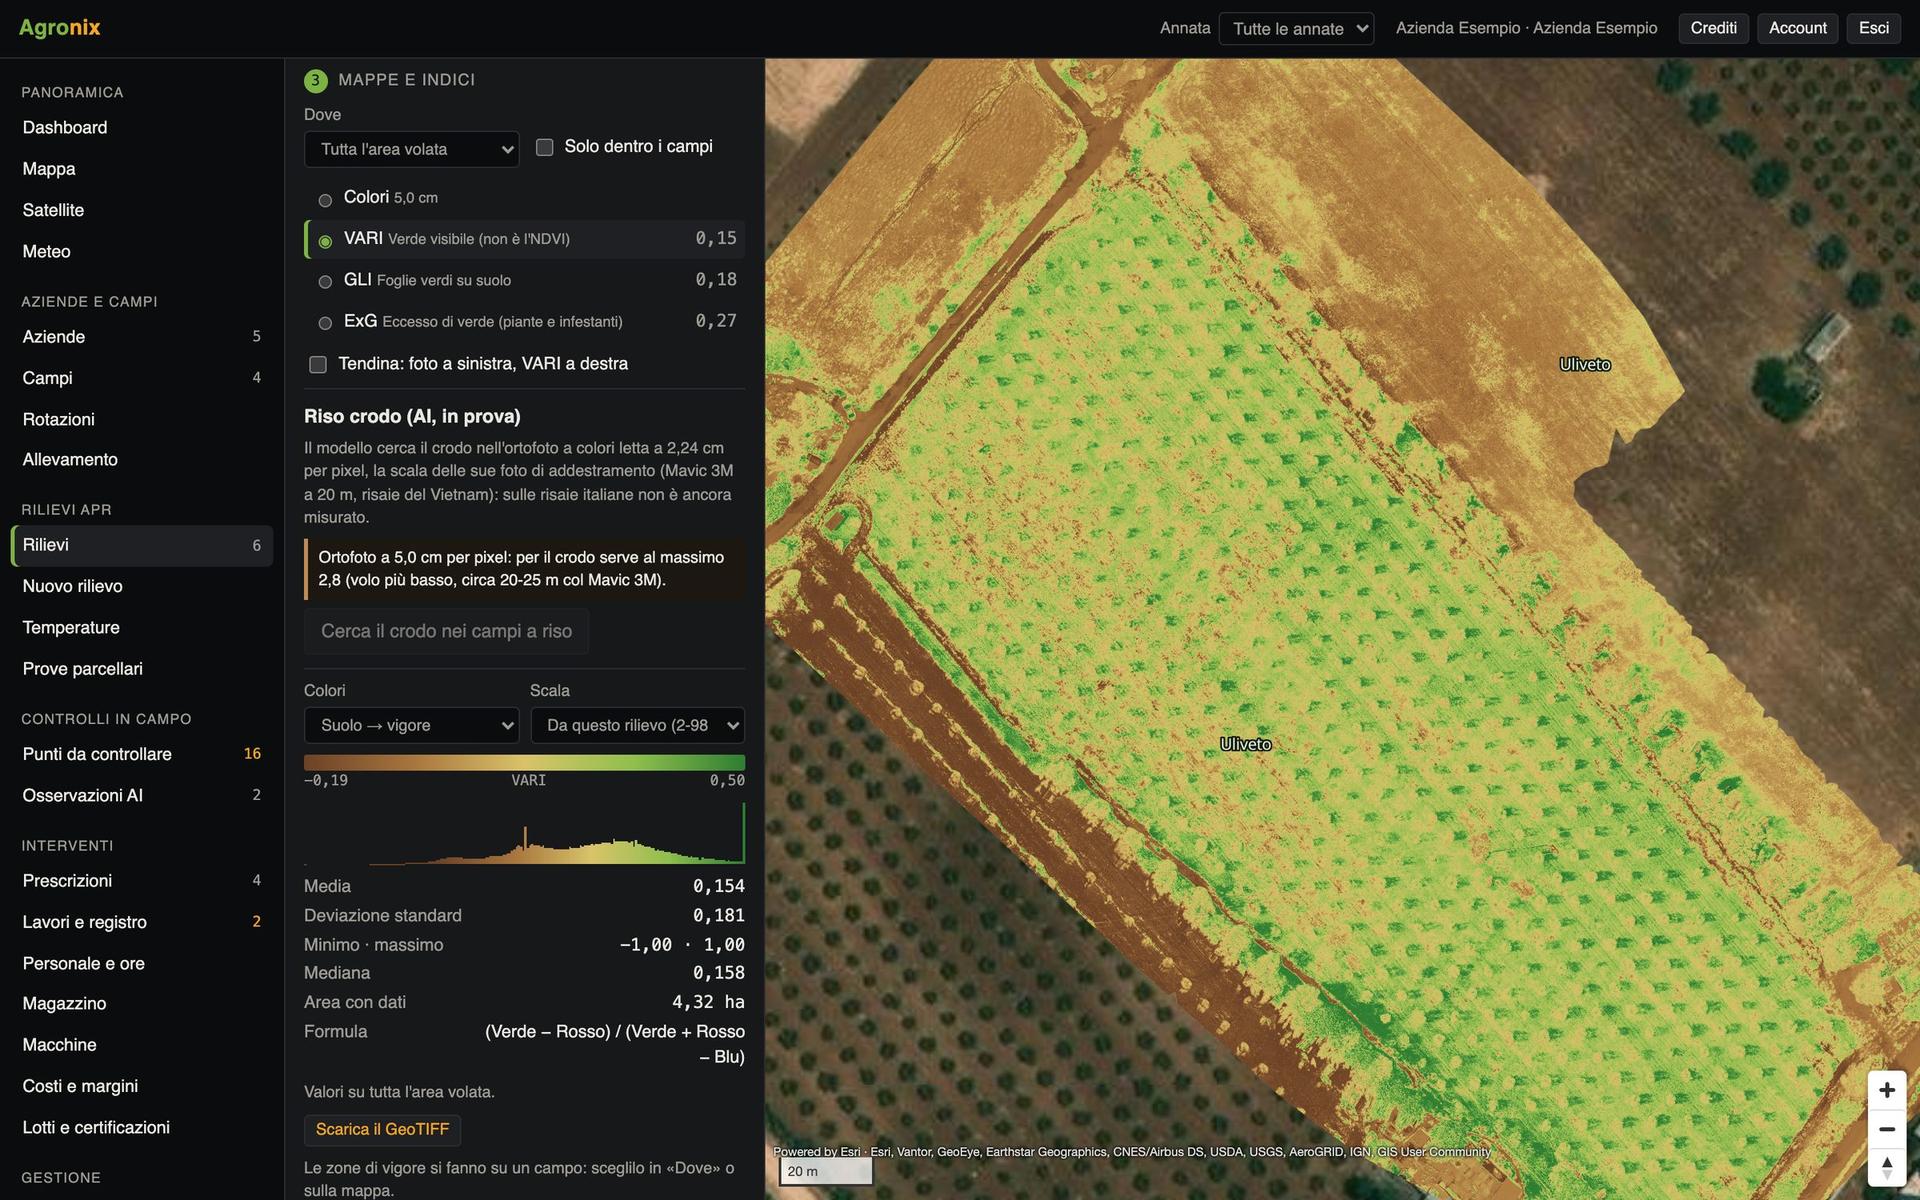
Nine indices from the same flight: NDVI for vigour, NDRE for chlorophyll and nitrogen even on a closed canopy, NDWI for water and six more. The slider puts photo and index on the same spot.
- Bare soil excluded from field averages
- Histogram, mean and deviation per field
- GeoTIFF clipped to the boundary
Measure crop temperature
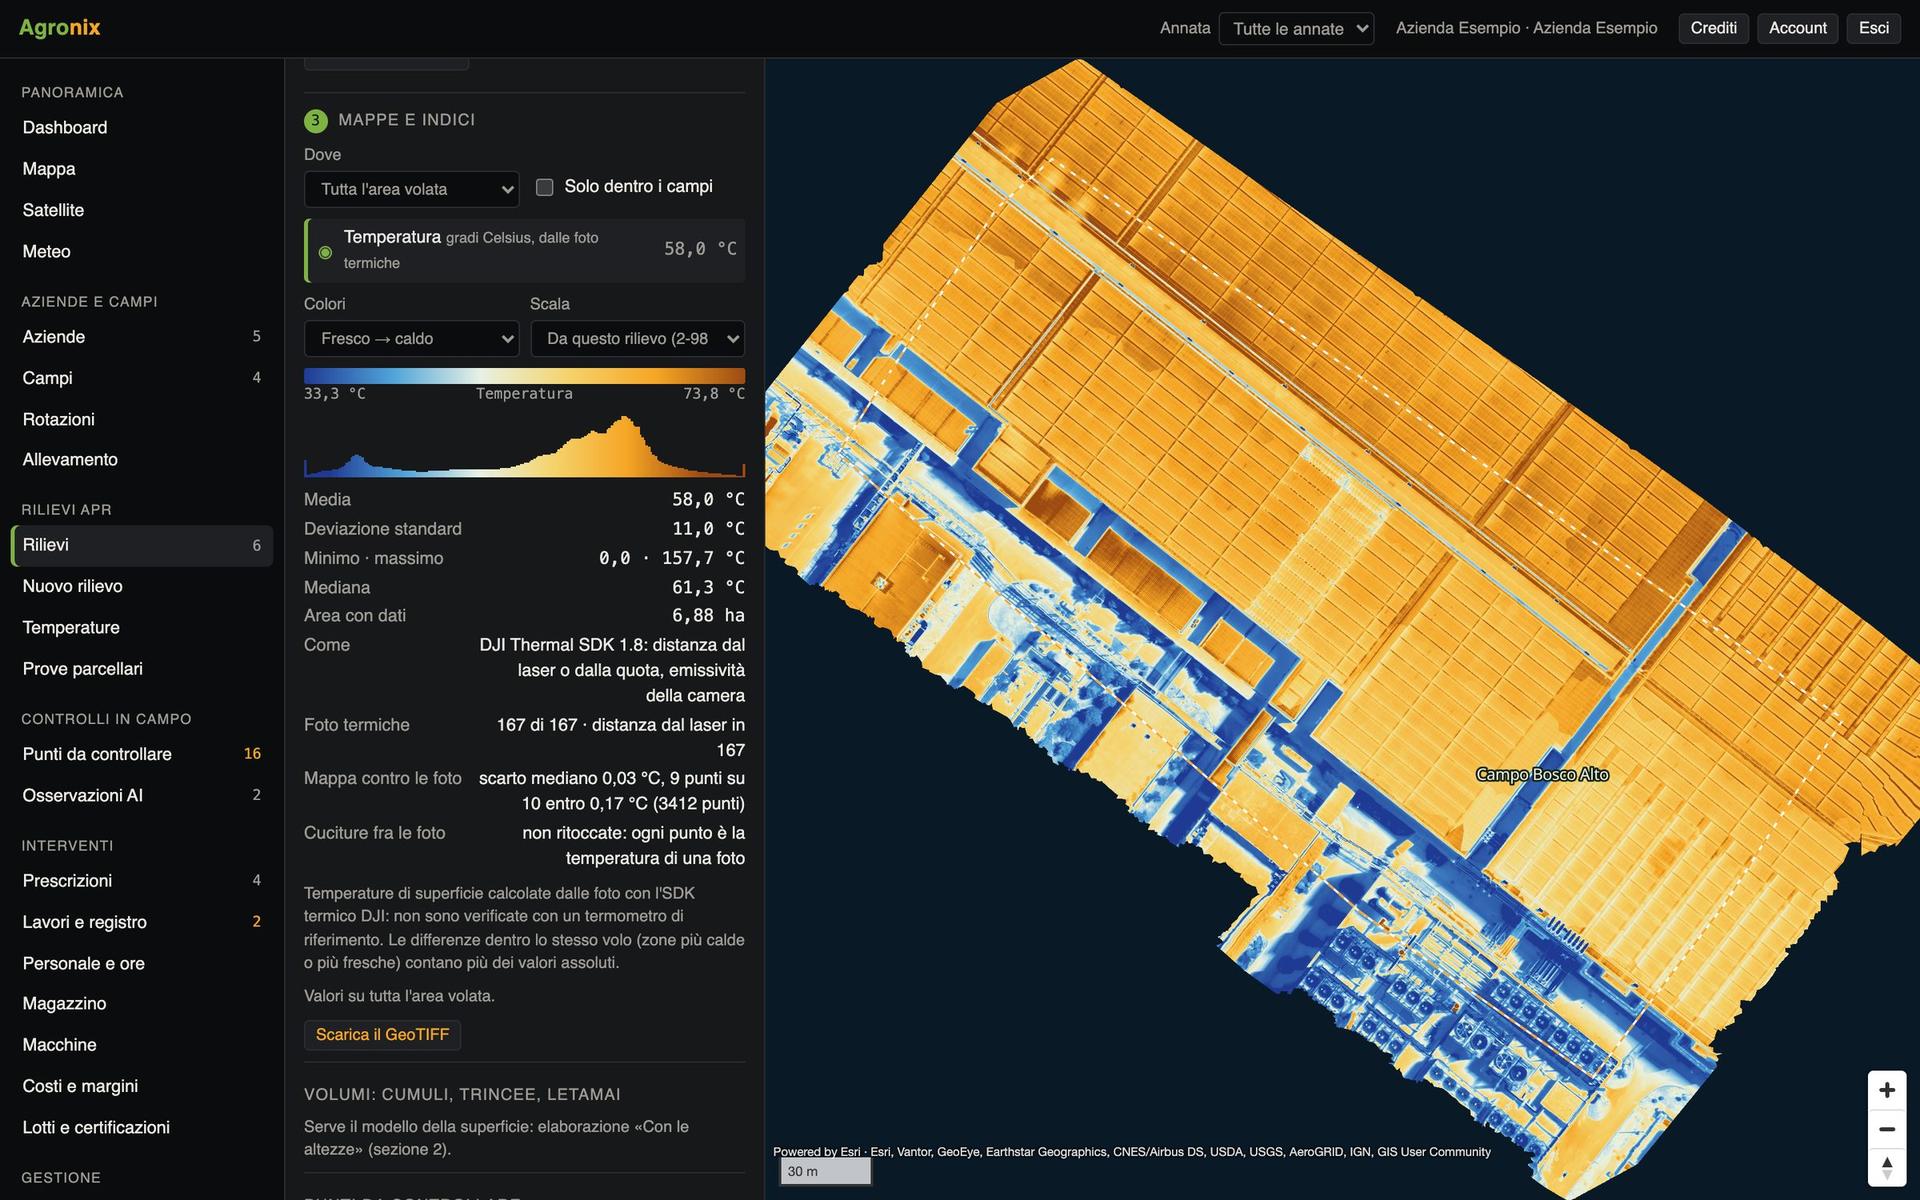
A map in degrees Celsius from radiometric thermal photos: the warmest part of the field transpires less, the coolest may be waterlogged.
- Temperature on every pixel
- Actual distance of every shot in the calculation
- GeoTIFF map for GIS software
Count and measure the trees
For orchards, olive groves and hazelnut groves the survey with heights counts the plants and measures height, canopy and volume. From the same model: rice paddy levelling and stockpile volumes.
- Height and canopy of every tree
- Canopy volume to dose treatments
- Export to CSV, KML and shapefile
Vigour and satellite
Every field's season, day by day
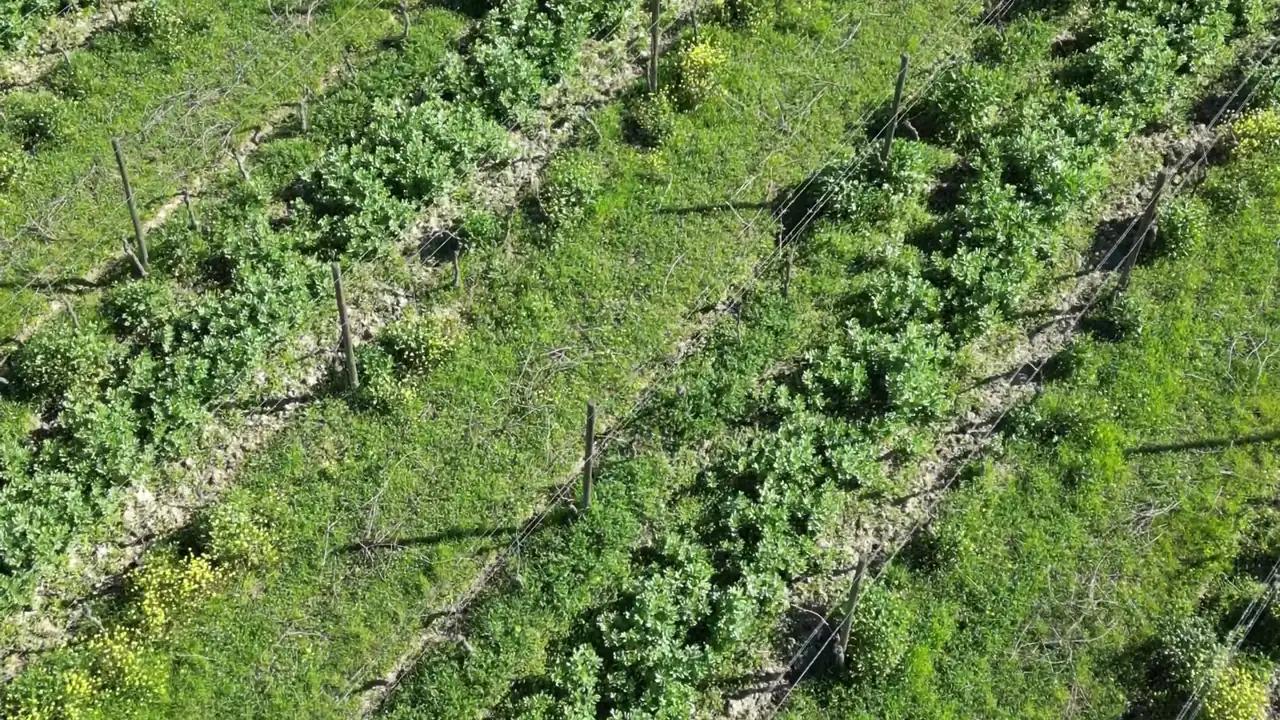
The satellite sees the whole field every few days, the drone sees it to the centimetre when it flies. Agronix puts them together.
Follow the season in one chart
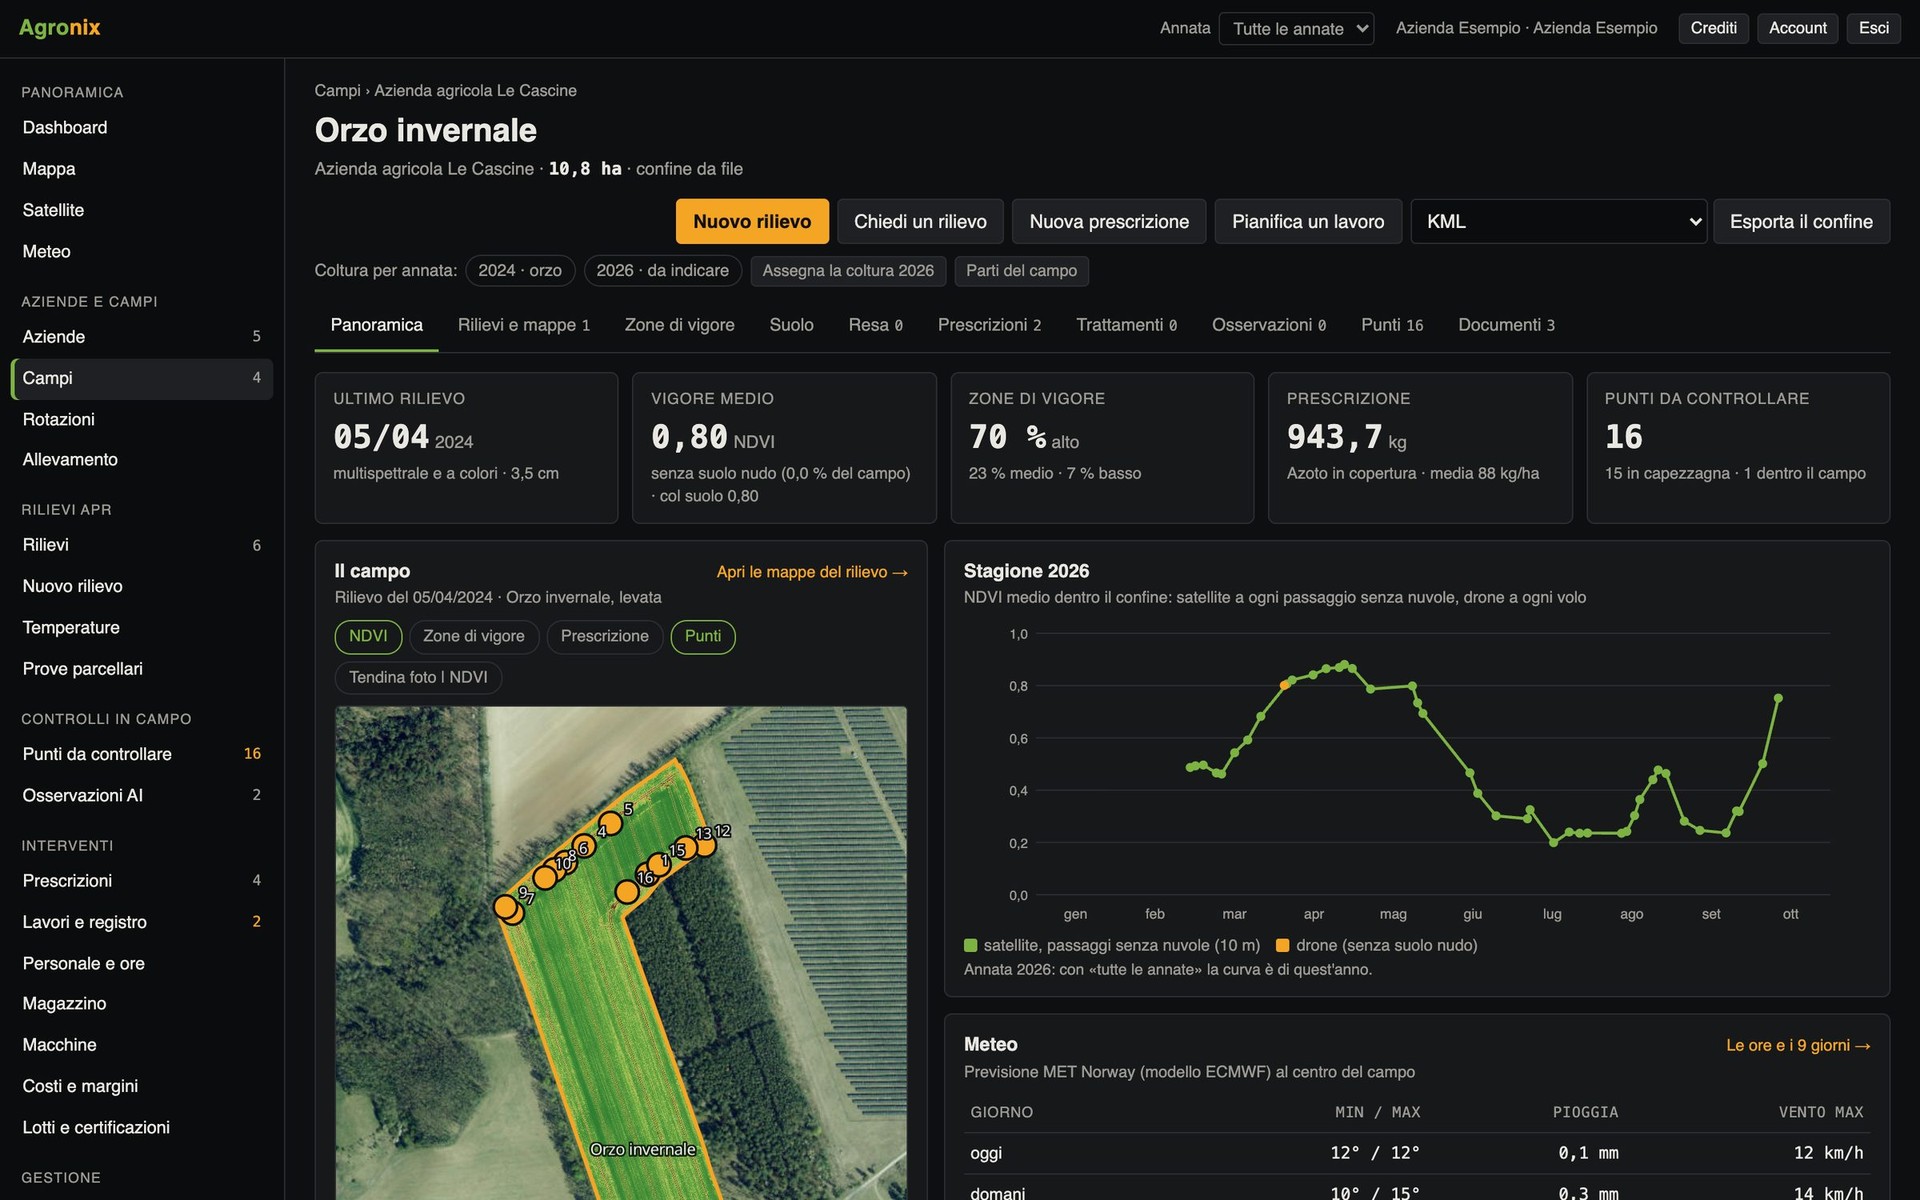
On every field's page: vigour flight by flight and from satellite, the crop of each season, zones, prescriptions and the weather for the coming days.
- Crop by season and rotations
- Satellite and drone on the same chart
- Weather at the field centre
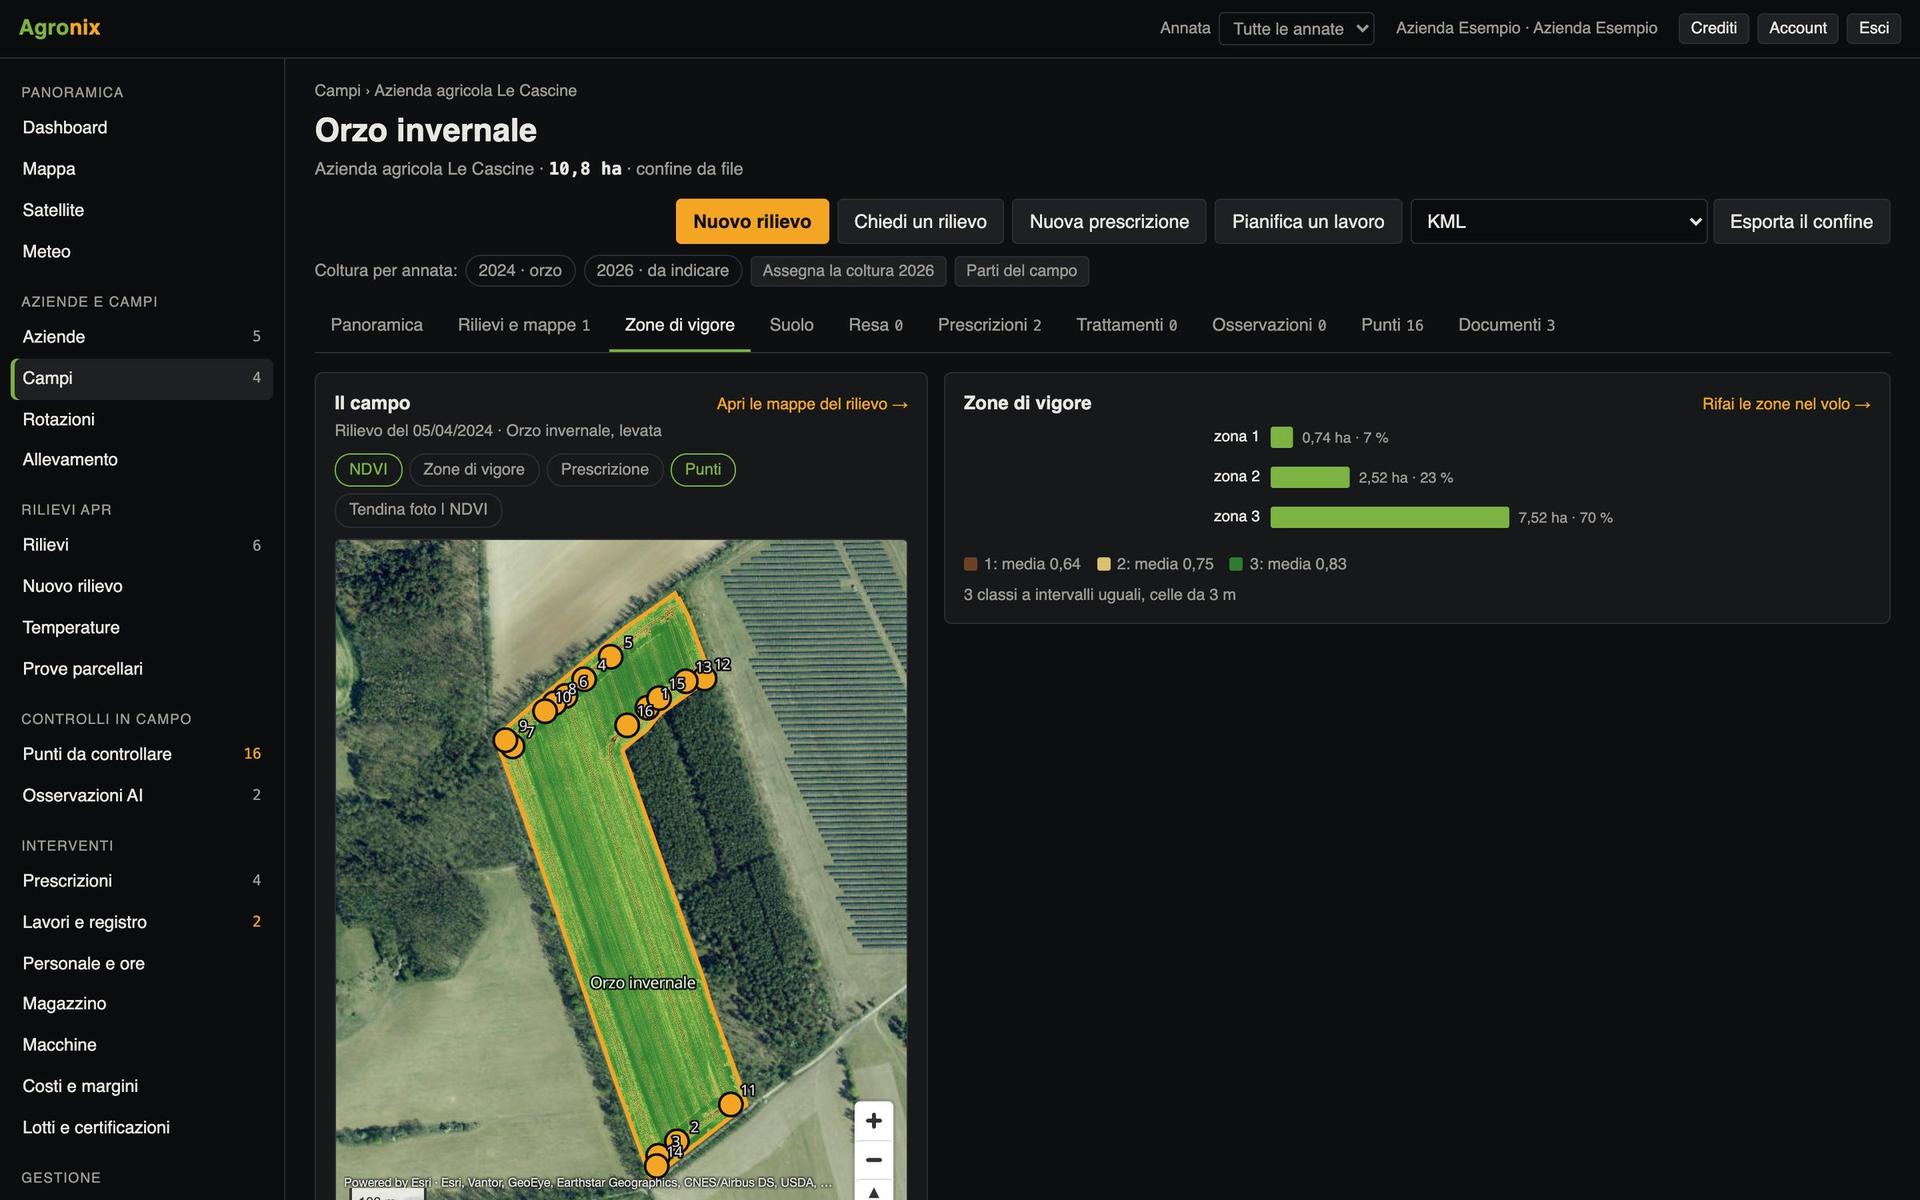
Split the field into vigour zones
Cells a few metres across, equal-interval, quantile or natural classes: zones are the basis for prescriptions and can be exported to other software.
- Hectares and mean of every zone
- Isolated cells cleaned up
- KML, shapefile and GeoJSON
The satellite between surveys
Sentinel-2 imagery at 10 metres, only passes with a clear field. When vigour drops quickly an alert is sent.
- Vigour trend for every field
- Clouds and shadows excluded automatically
- Falling vigour alert
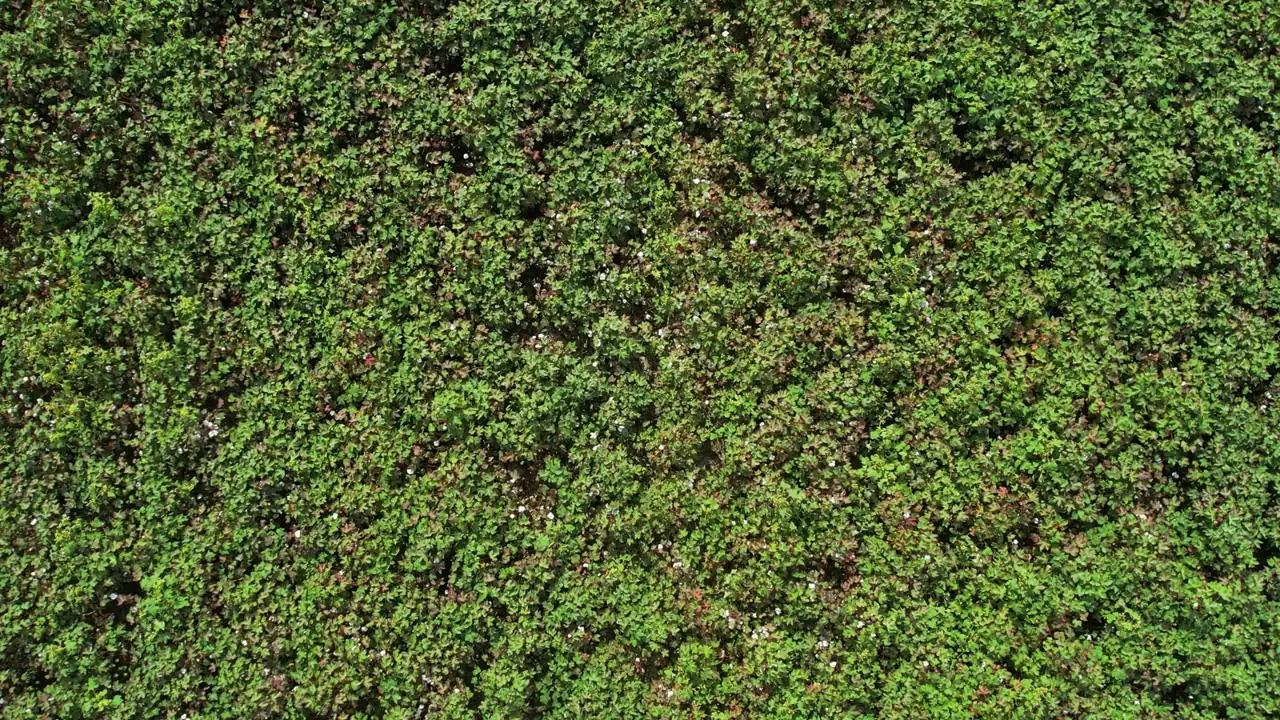
Field scouting
Knowing where to look
The maps flag the points to check, the phone takes you there, the AI helps recognise what you see.
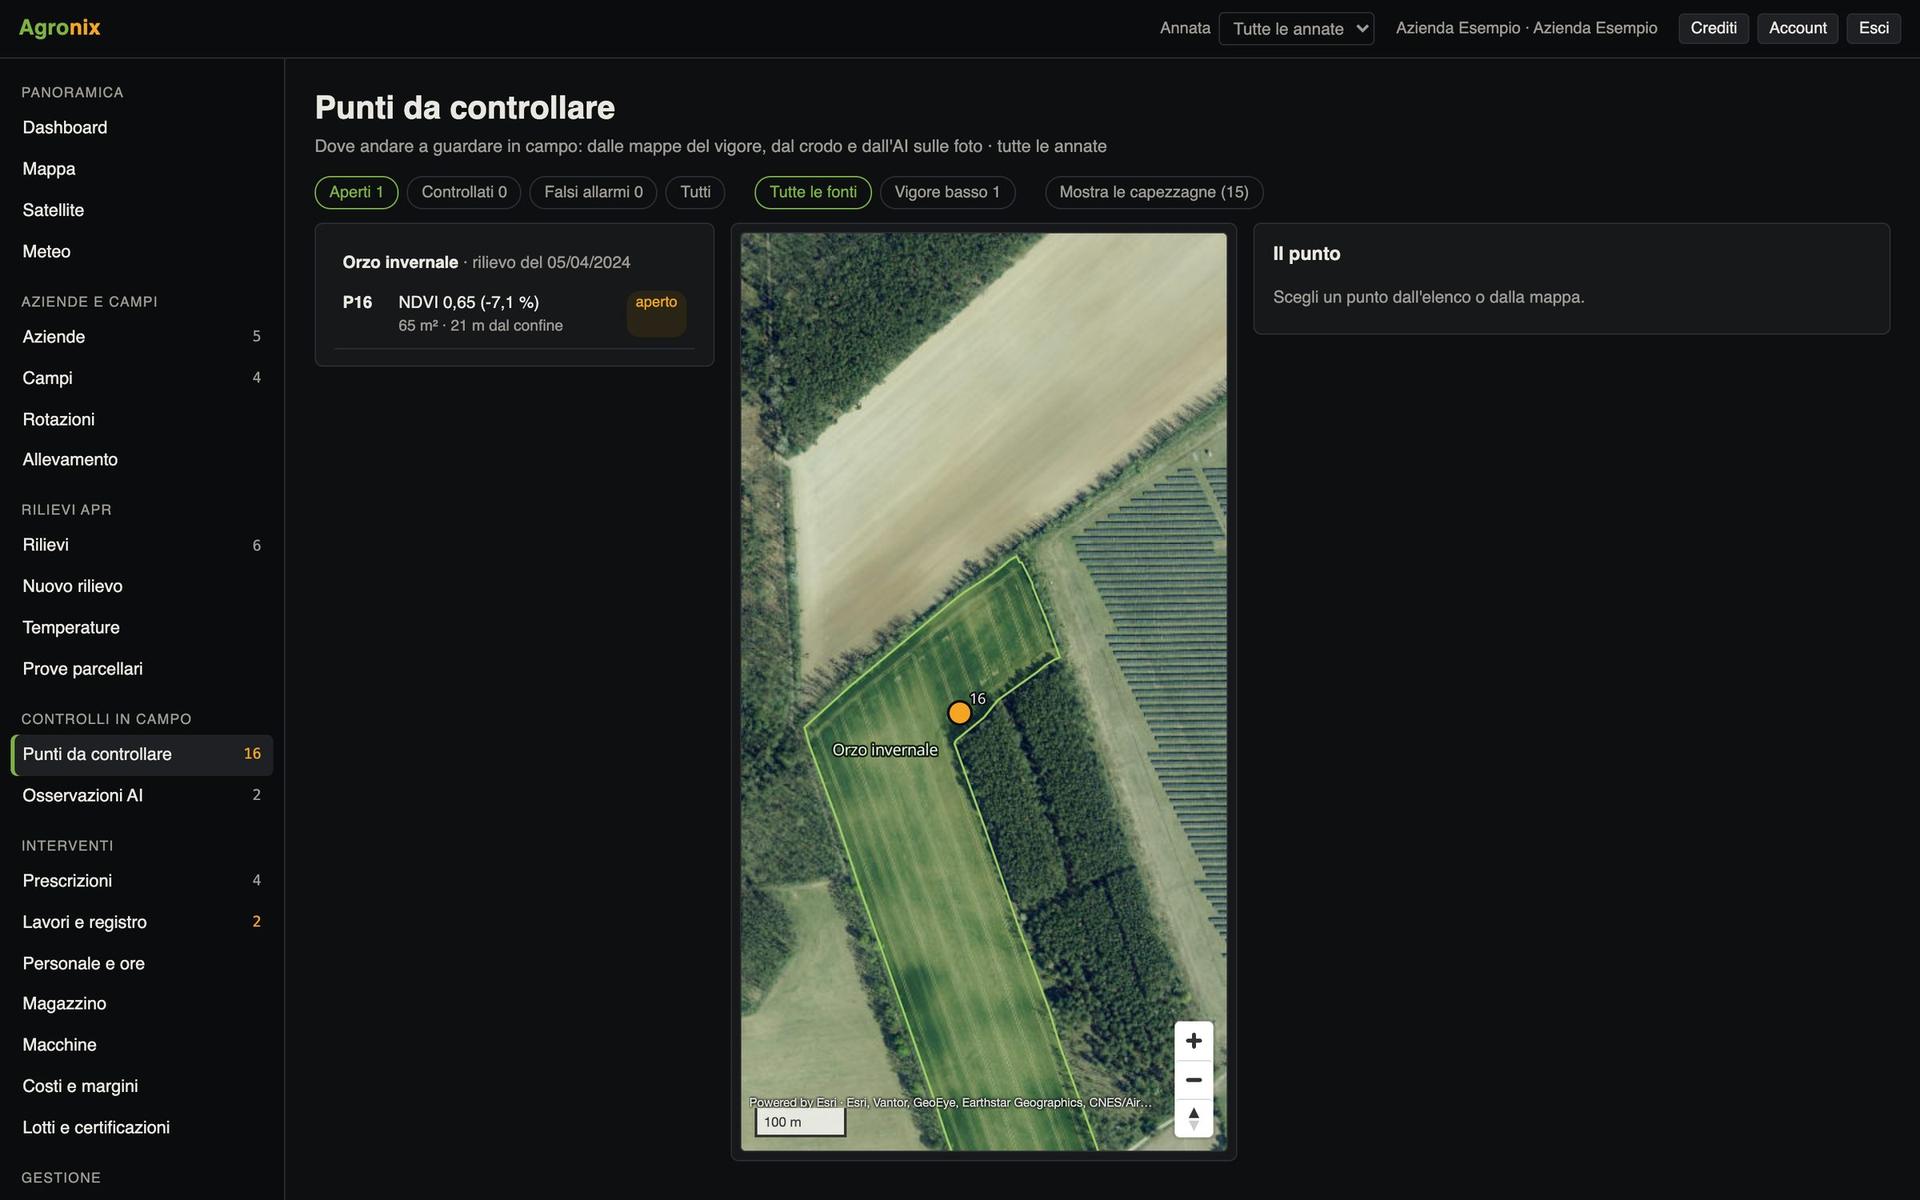
Go where the field grows less
Agronix finds the zones with much lower vigour than the rest of the same field and lists them. On the phone, «Take me there» shows distance and direction.
- Wheel tracks and headlands do not count
- «Photograph here» for an on-the-spot photo
- Checked or false alarm, with the date
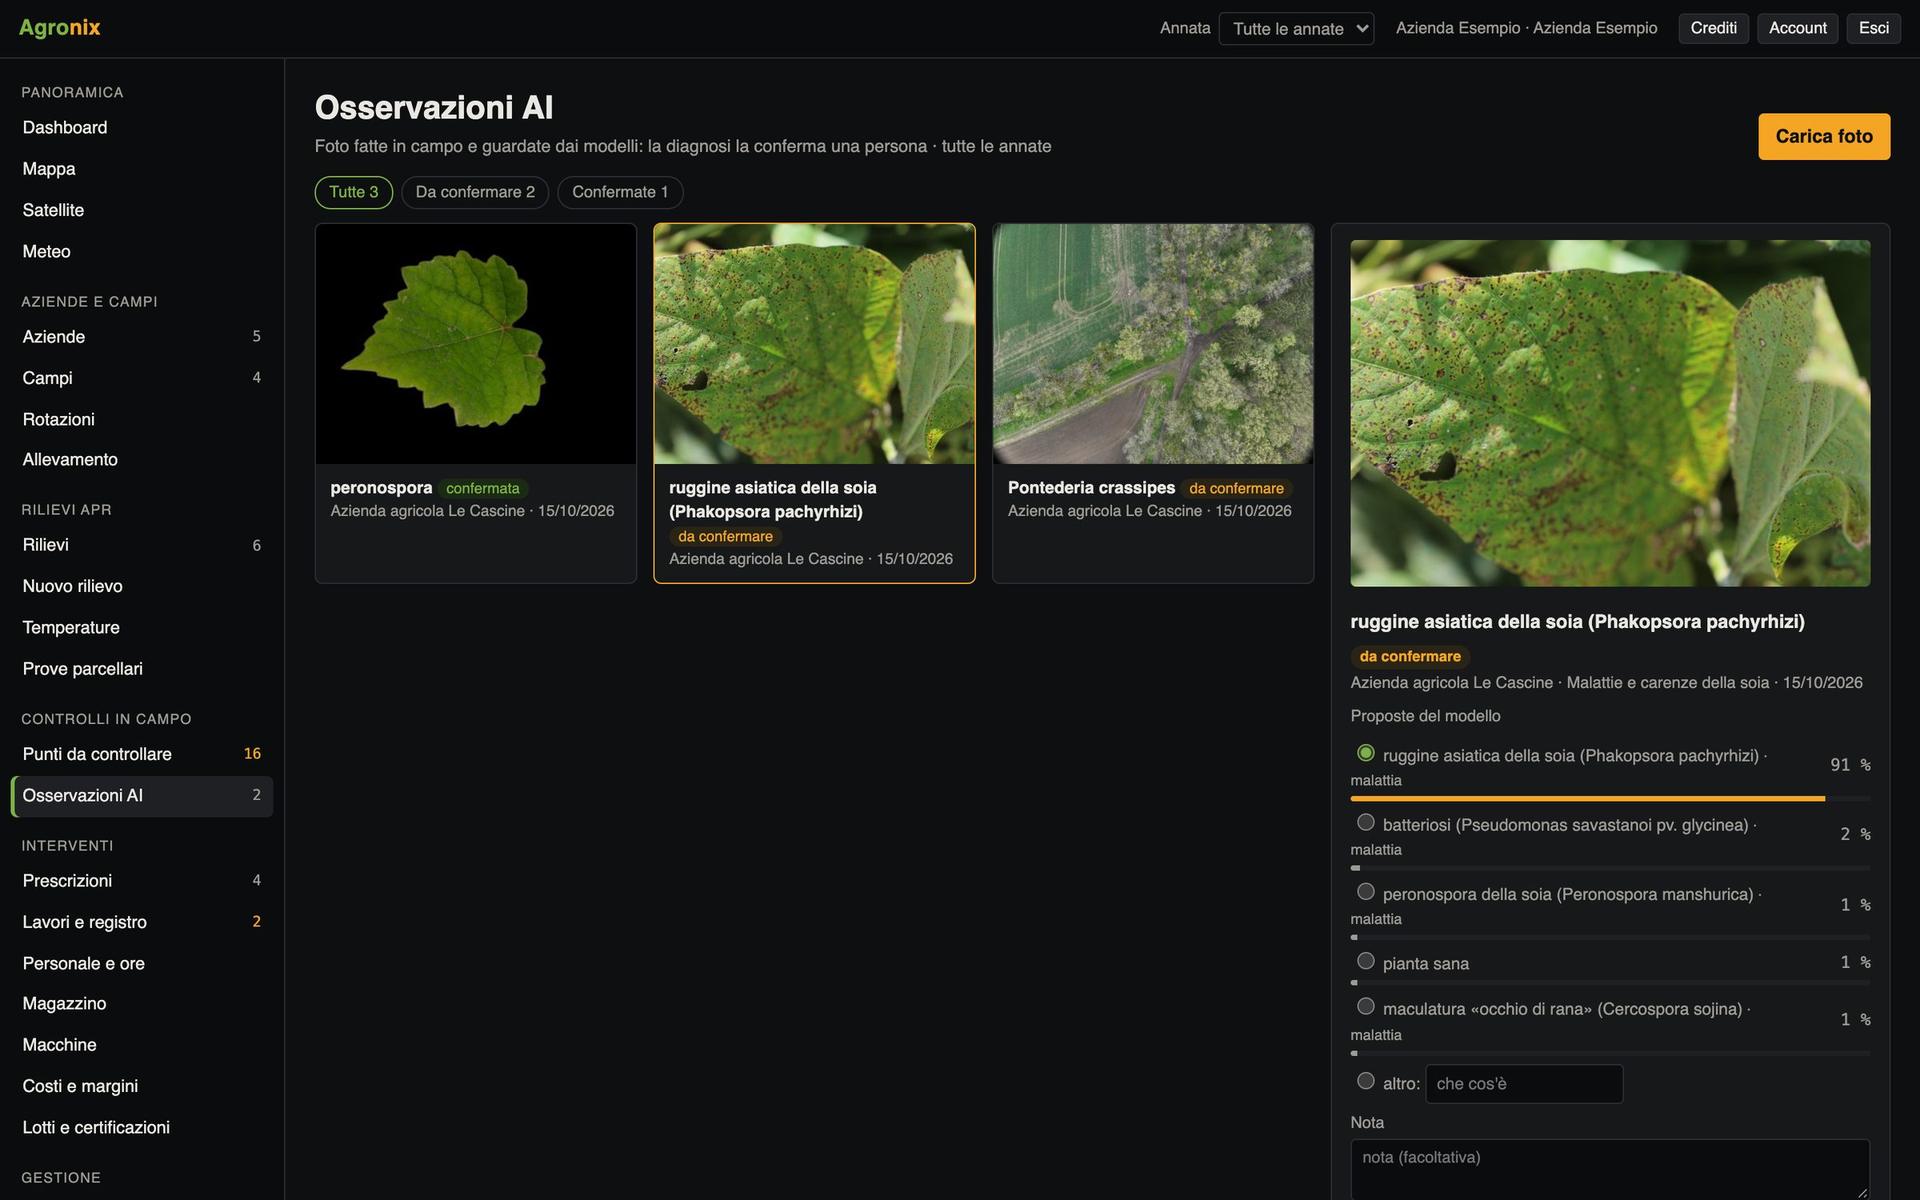
Recognise diseases and pests from photos
A close-up photo of leaves or fruit and the crop's model proposes a diagnosis with its probability. Vine, rice, cereals, maize, vegetables, orchards and olive.
- 35 models for crops, diseases and pests
- The diagnosis is always confirmed by a person
- Every observation on the field map
In the field, from the phone
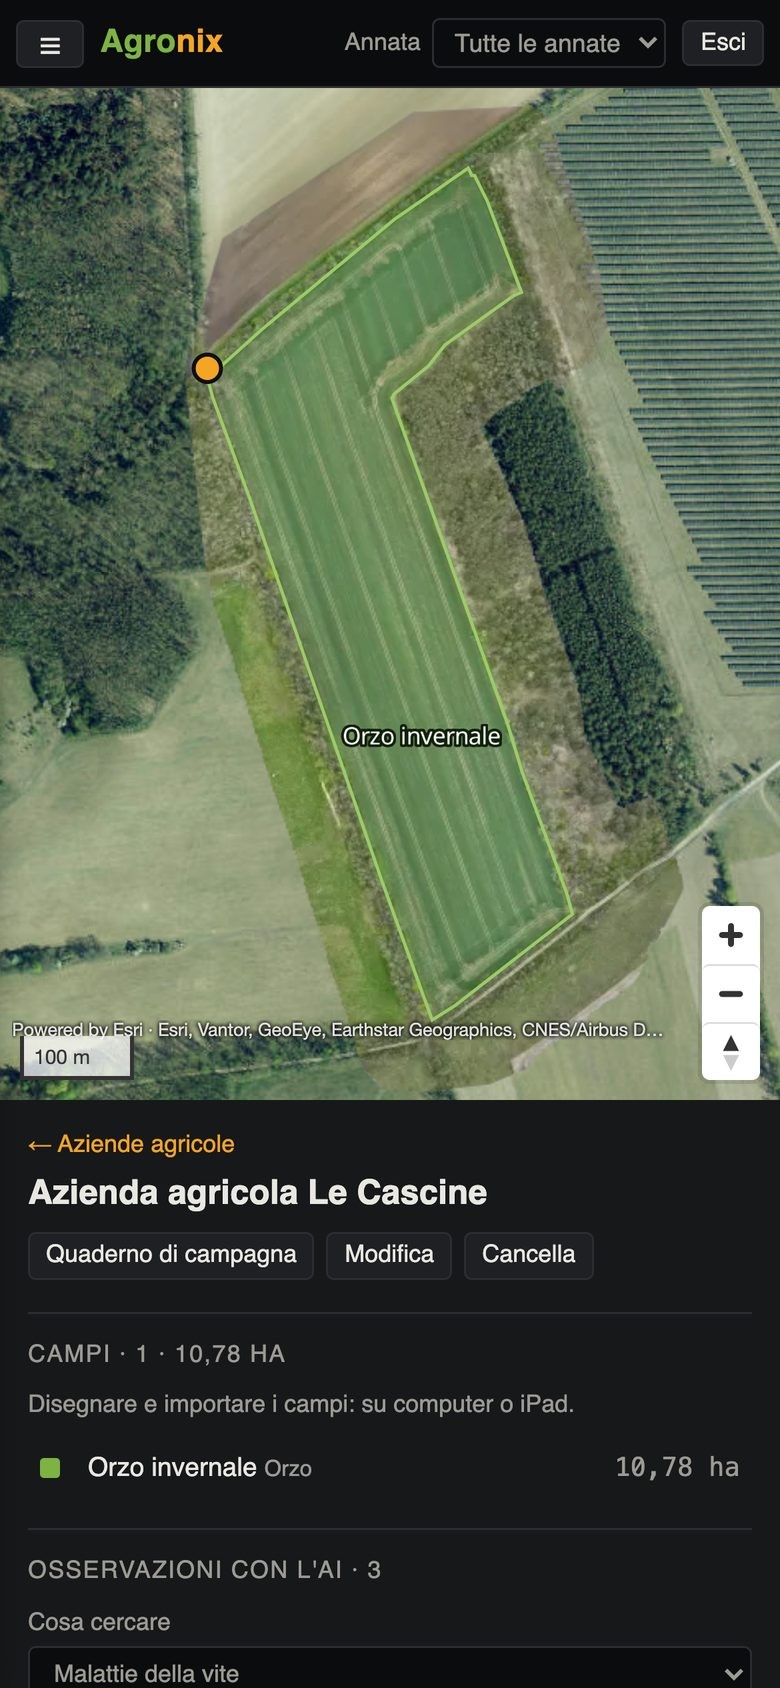
On the phone, what you need in the field: fields and maps, observations with photos, points to check and field logbook. Everything else from computer or tablet.
- Field map with your position
- Photo and diagnosis on the spot
- No risky operations from the phone
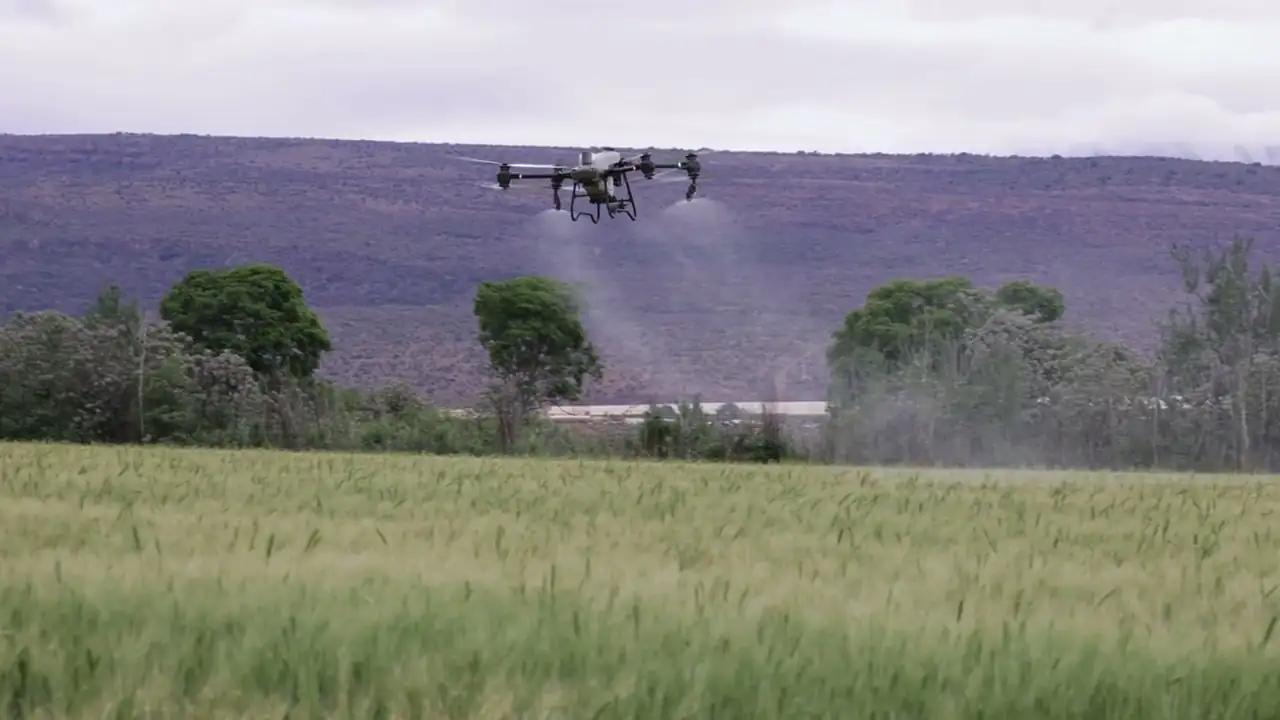
Prescriptions
The right rate everywhere in the field
From vigour zones to the rate map, then the file for the machine: spraying drone, tractor with ISOBUS terminal or manufacturers' terminals.
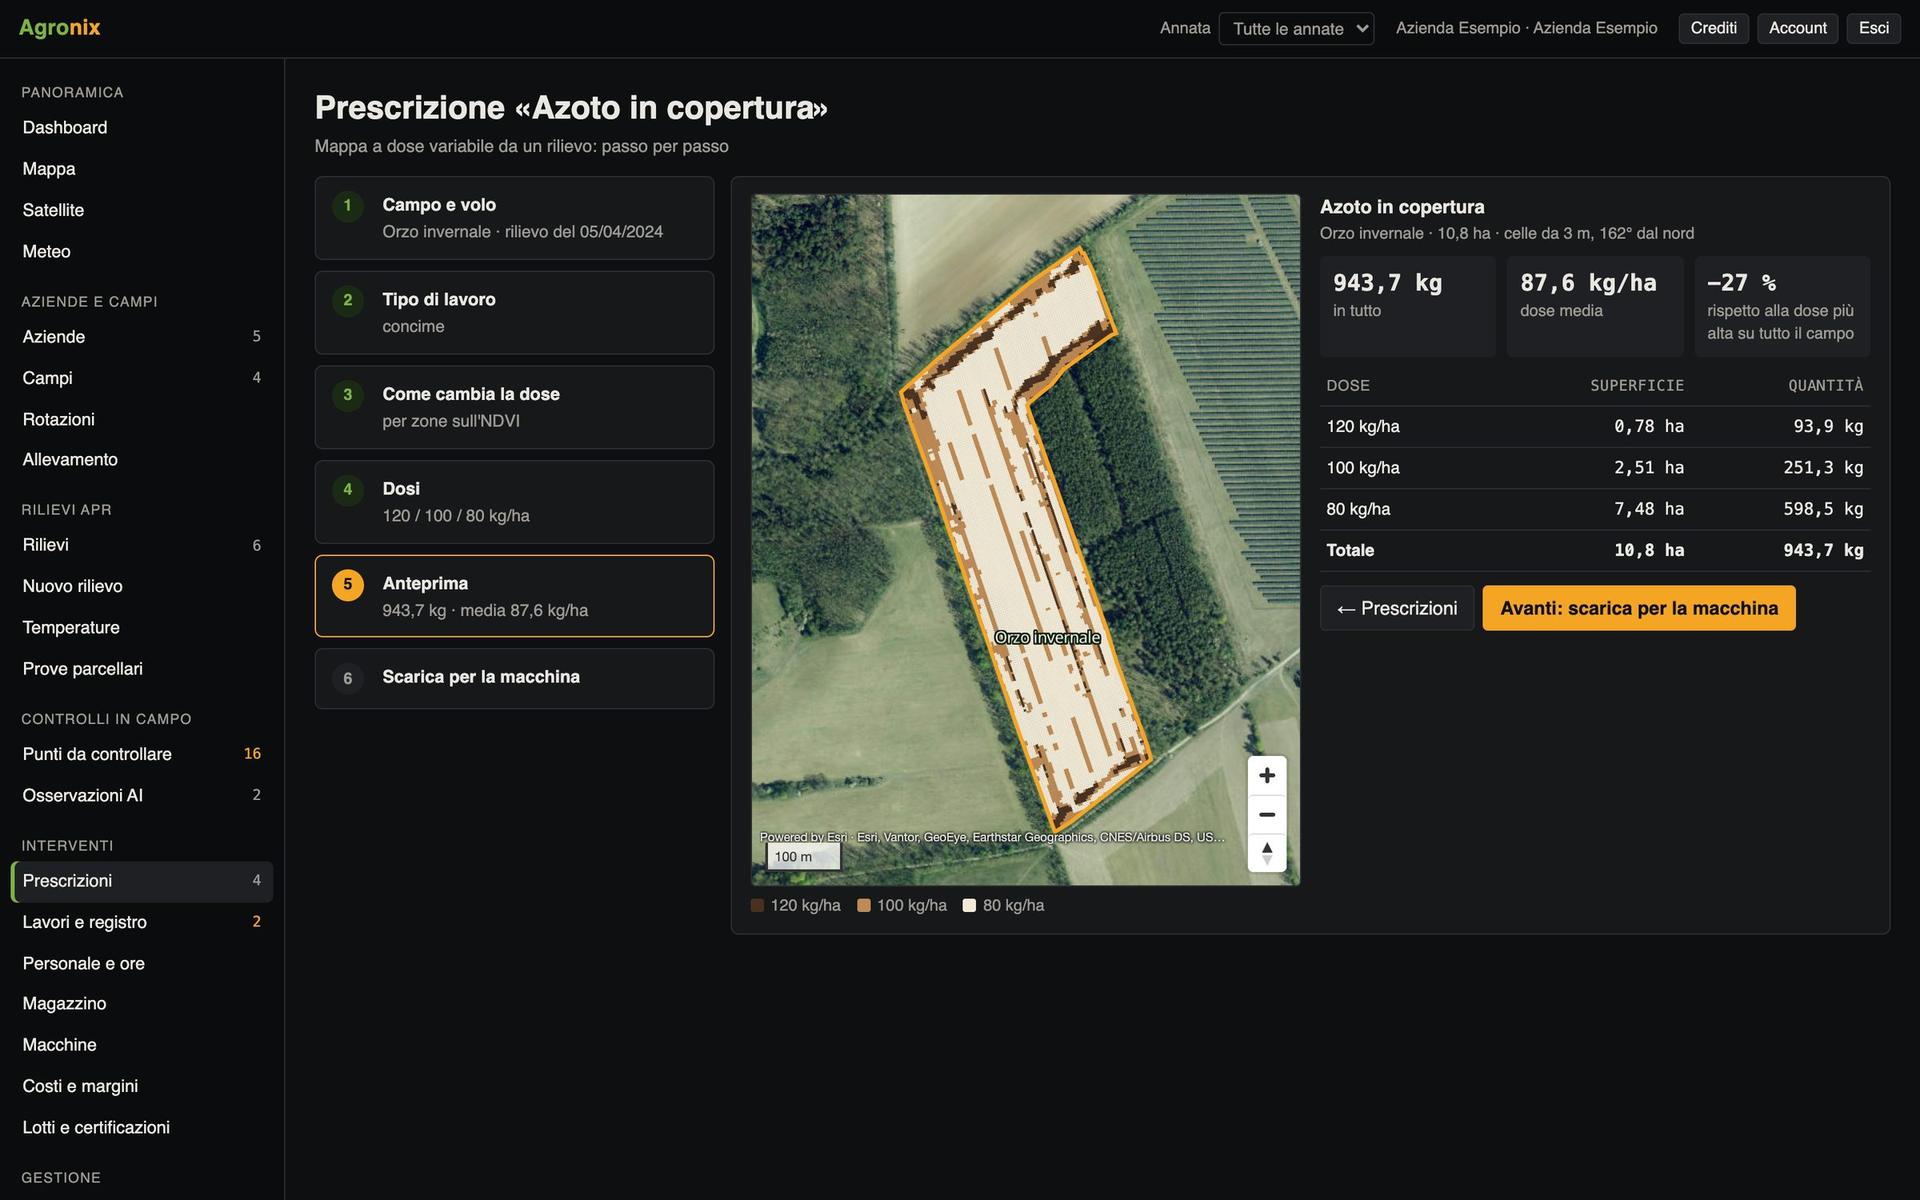
Create a prescription in six steps
Field and survey, type of work, how the rate varies, rates, preview, machine file. Fertiliser, seeding, crop protection and spot weeding.
- Rate per zone or in proportion to the index
- Totals and comparison with a flat rate
- Legal notice before crop protection products
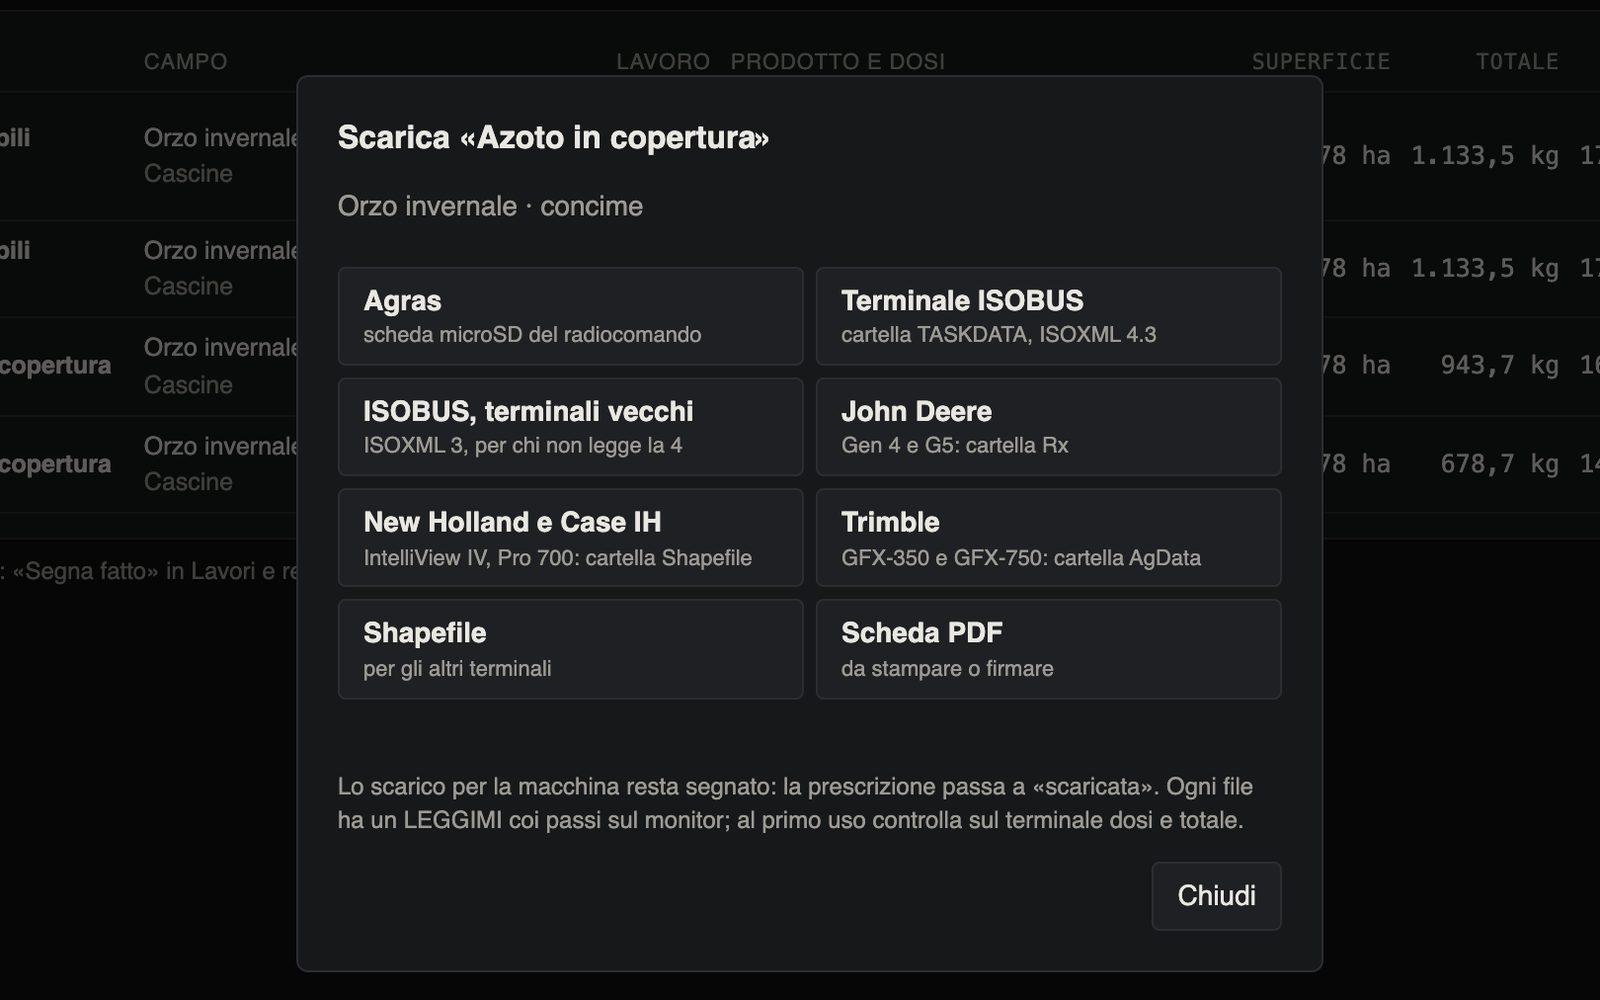
Download the file for your machine
One click and the prescription comes out in the right format, with folders ready for the USB stick and a README with the steps on the monitor.
- microSD card for the spraying drone
- ISOBUS TASKDATA, older terminals included
- Folders for the most common tractor terminals, shapefile and PDF
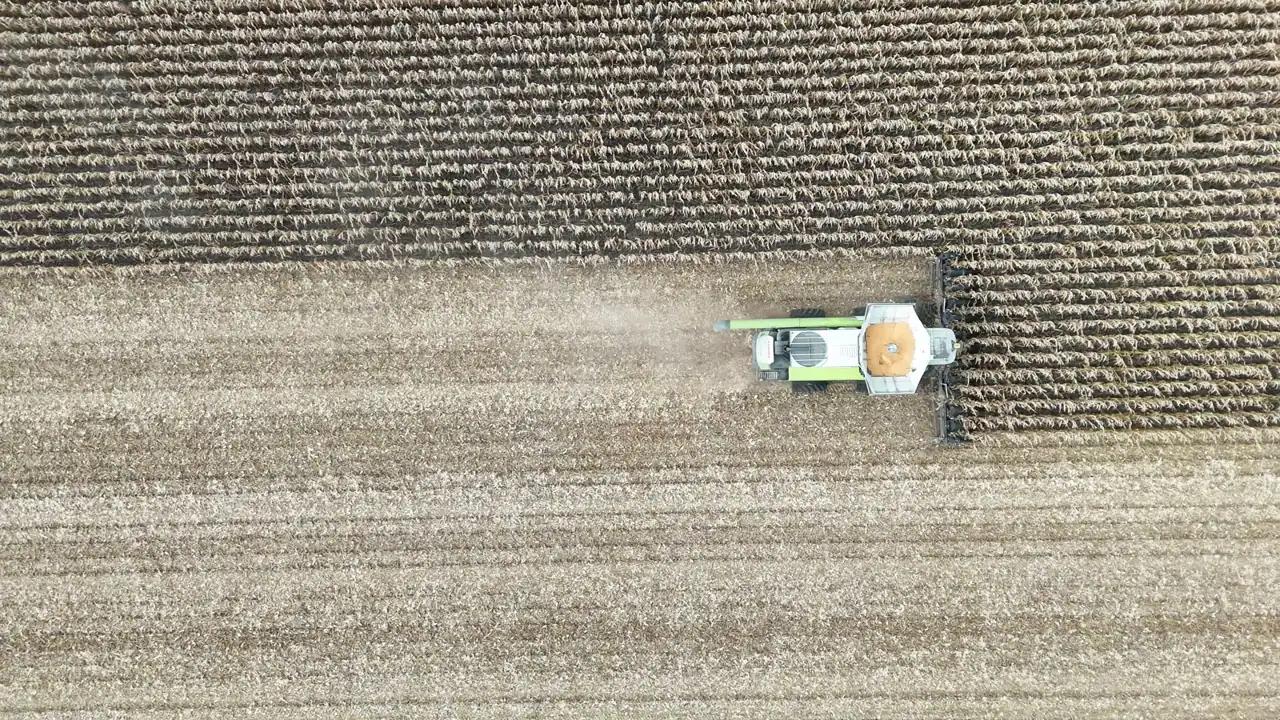
Records and compliance
Spray records and logbook always compliant
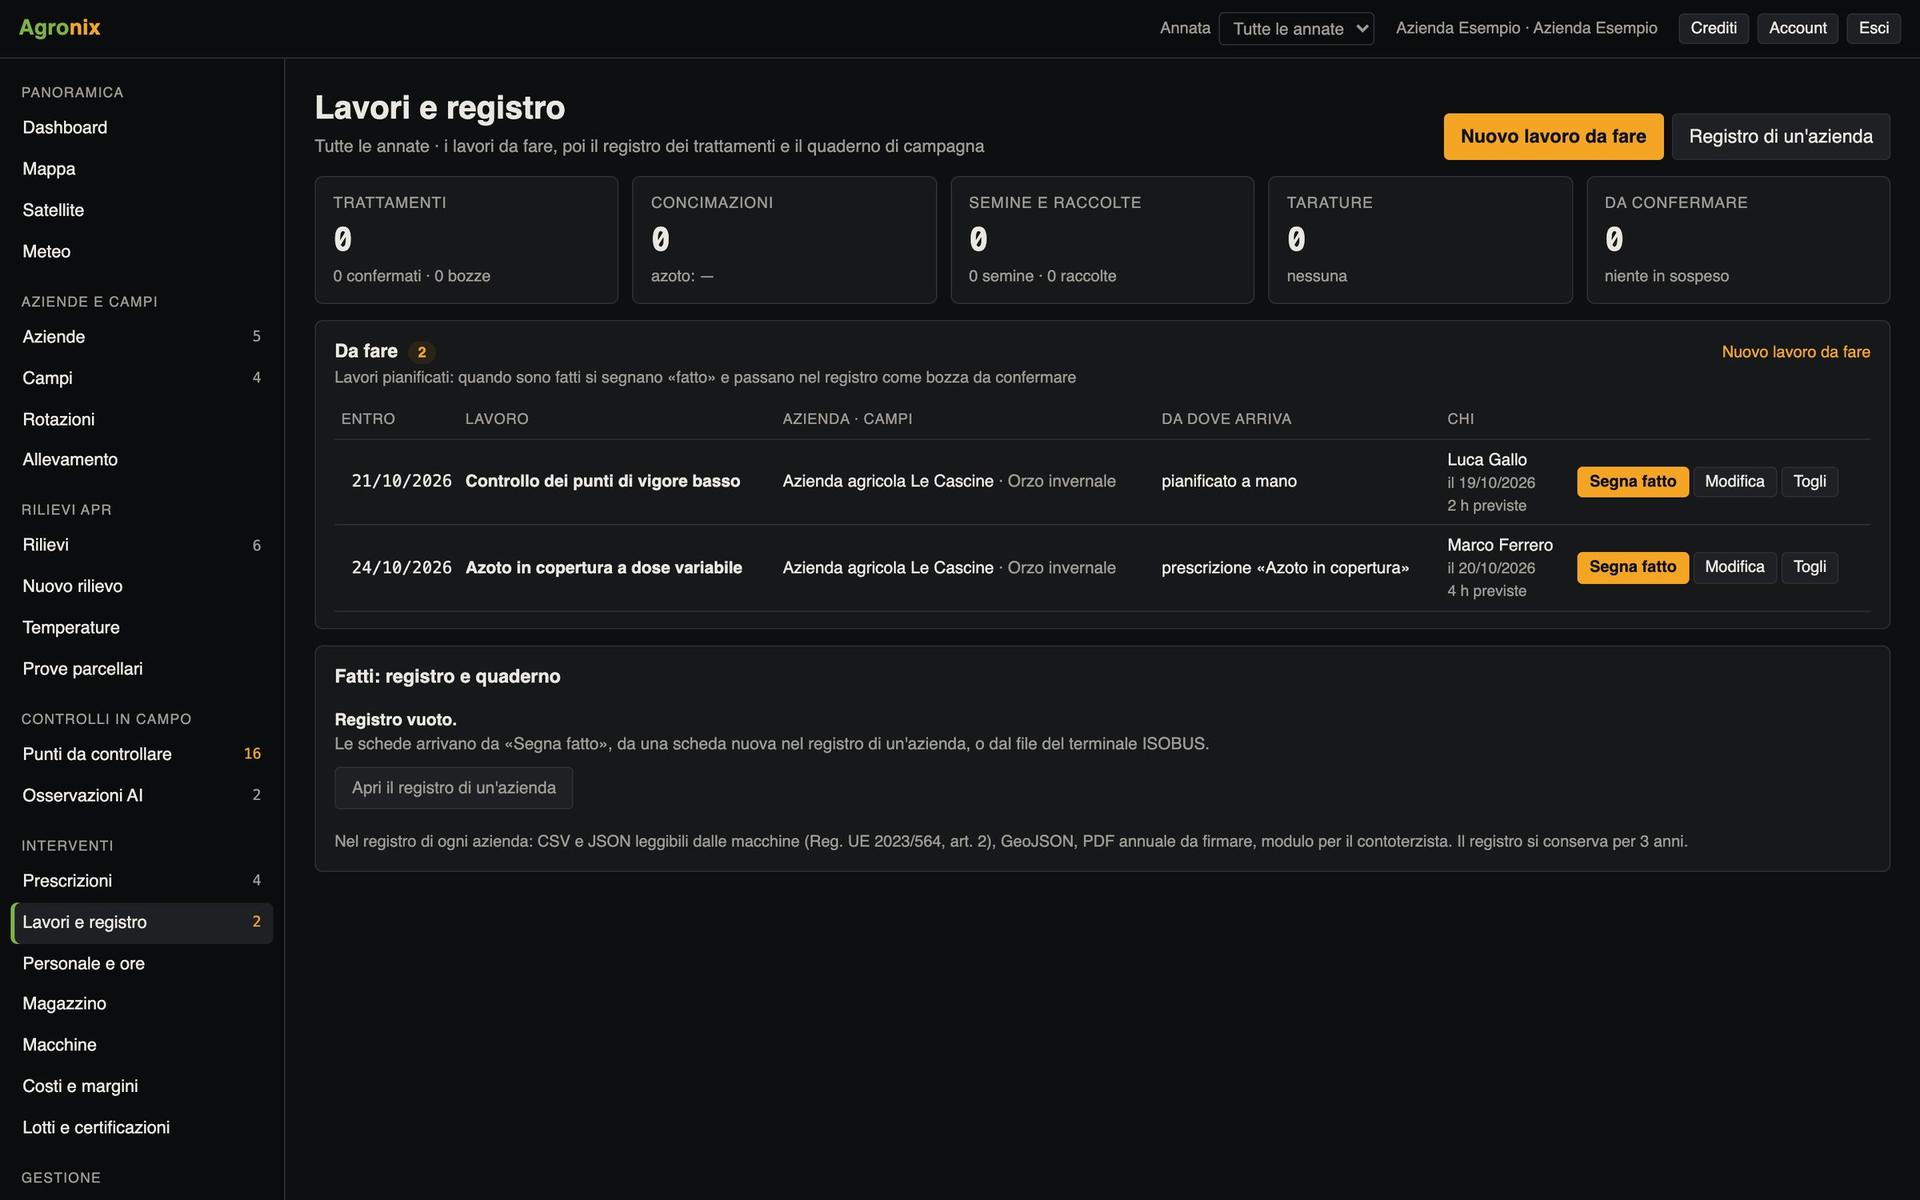
Work done becomes records: from the prescription, from the tractor terminal or from a new entry.
Electronic spray records
The fields required by Regulation (EU) 2023/564, every change saved as a new fingerprinted version, an annual PDF to sign and machine-readable files.
- Field logbook: fertilisers, seeding, harvests, irrigation
- As-applied data from the ISOBUS terminal
- Package ready for the farm advisory centre
Authorised products and growth stages
The Italian Ministry of Health plant protection products database, updated every week, with revoked and expired products flagged. BBCH growth stages and crop codes.
- Search by name, active substance or registration number
- Warning when harvest falls within the pre-harvest interval
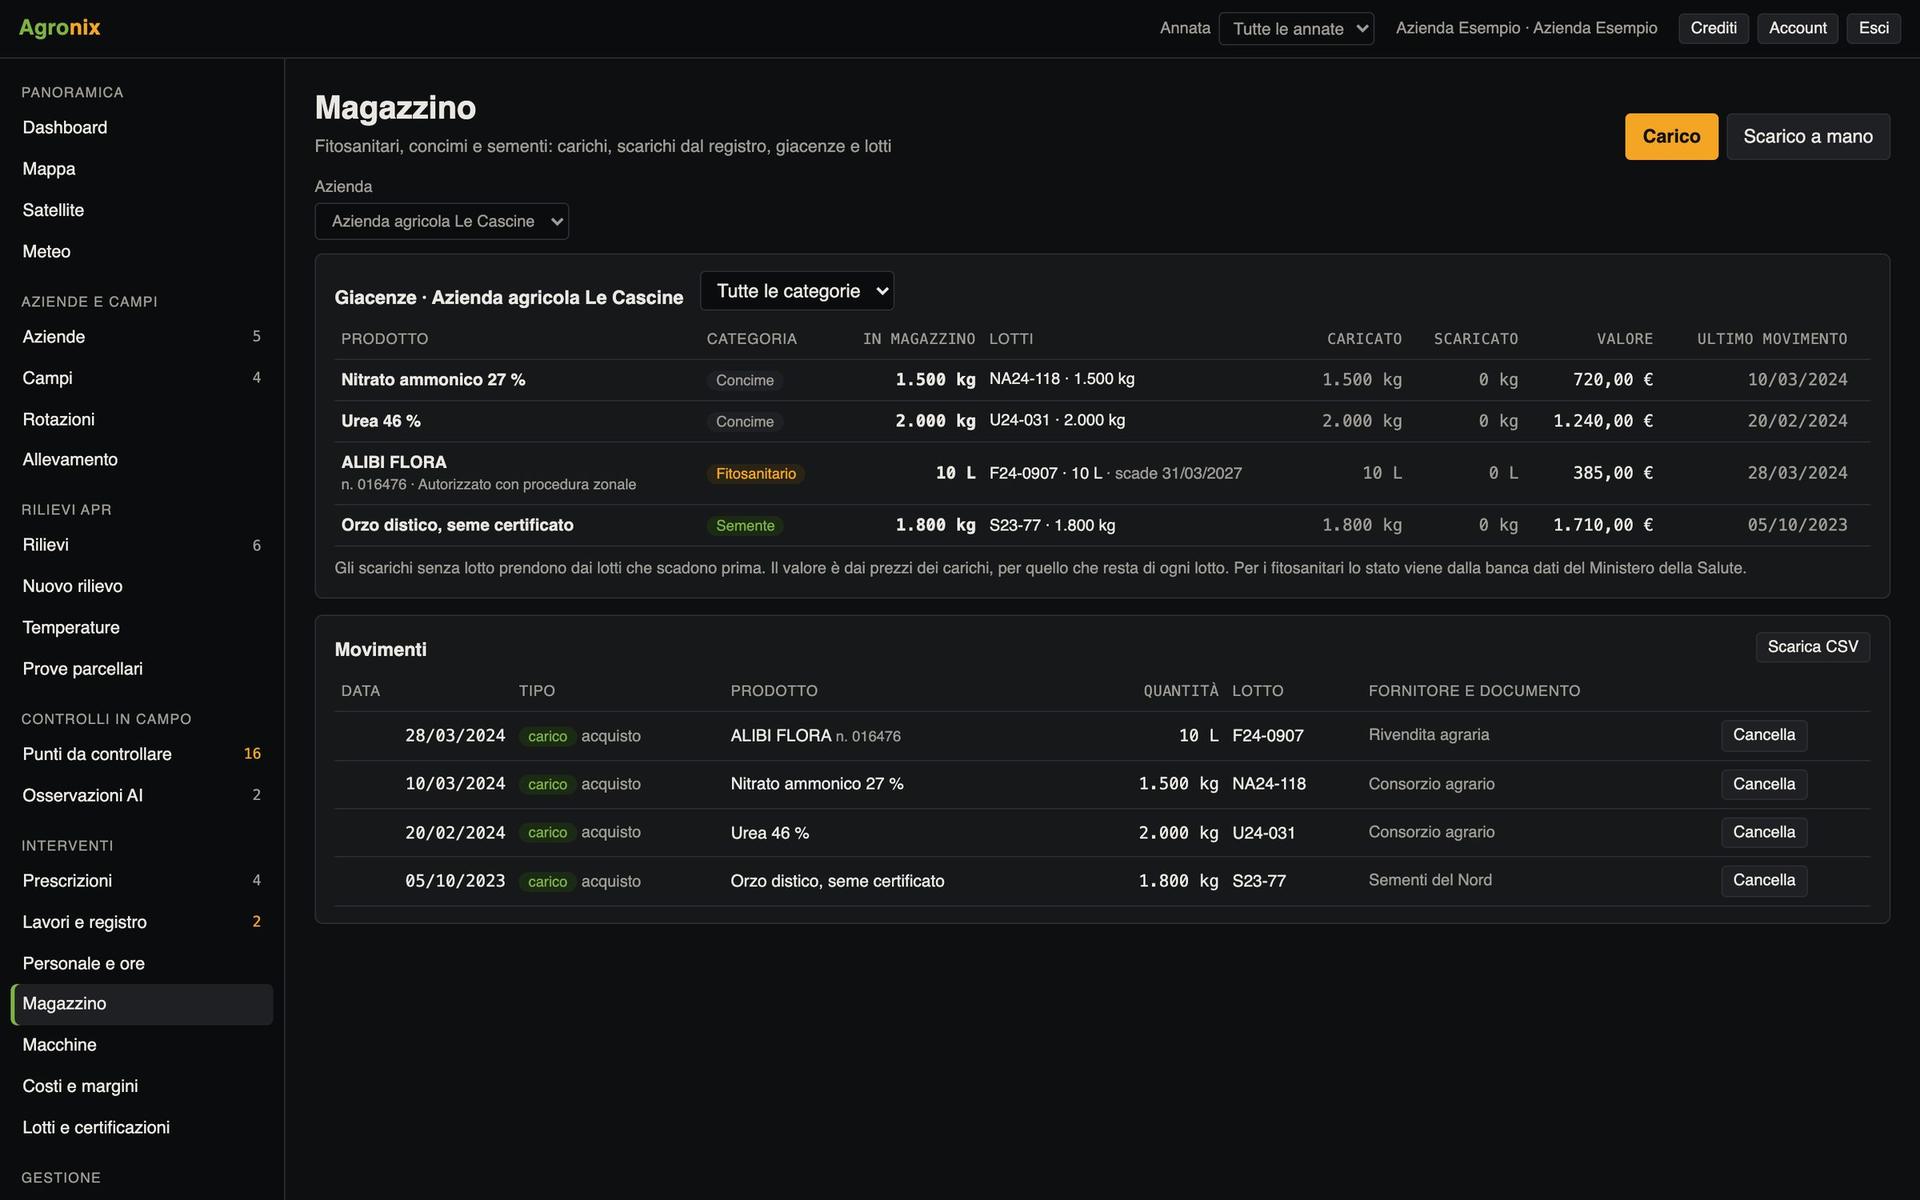
- Stock deducted from the records
Rotations, Natura 2000 and nitrate zones
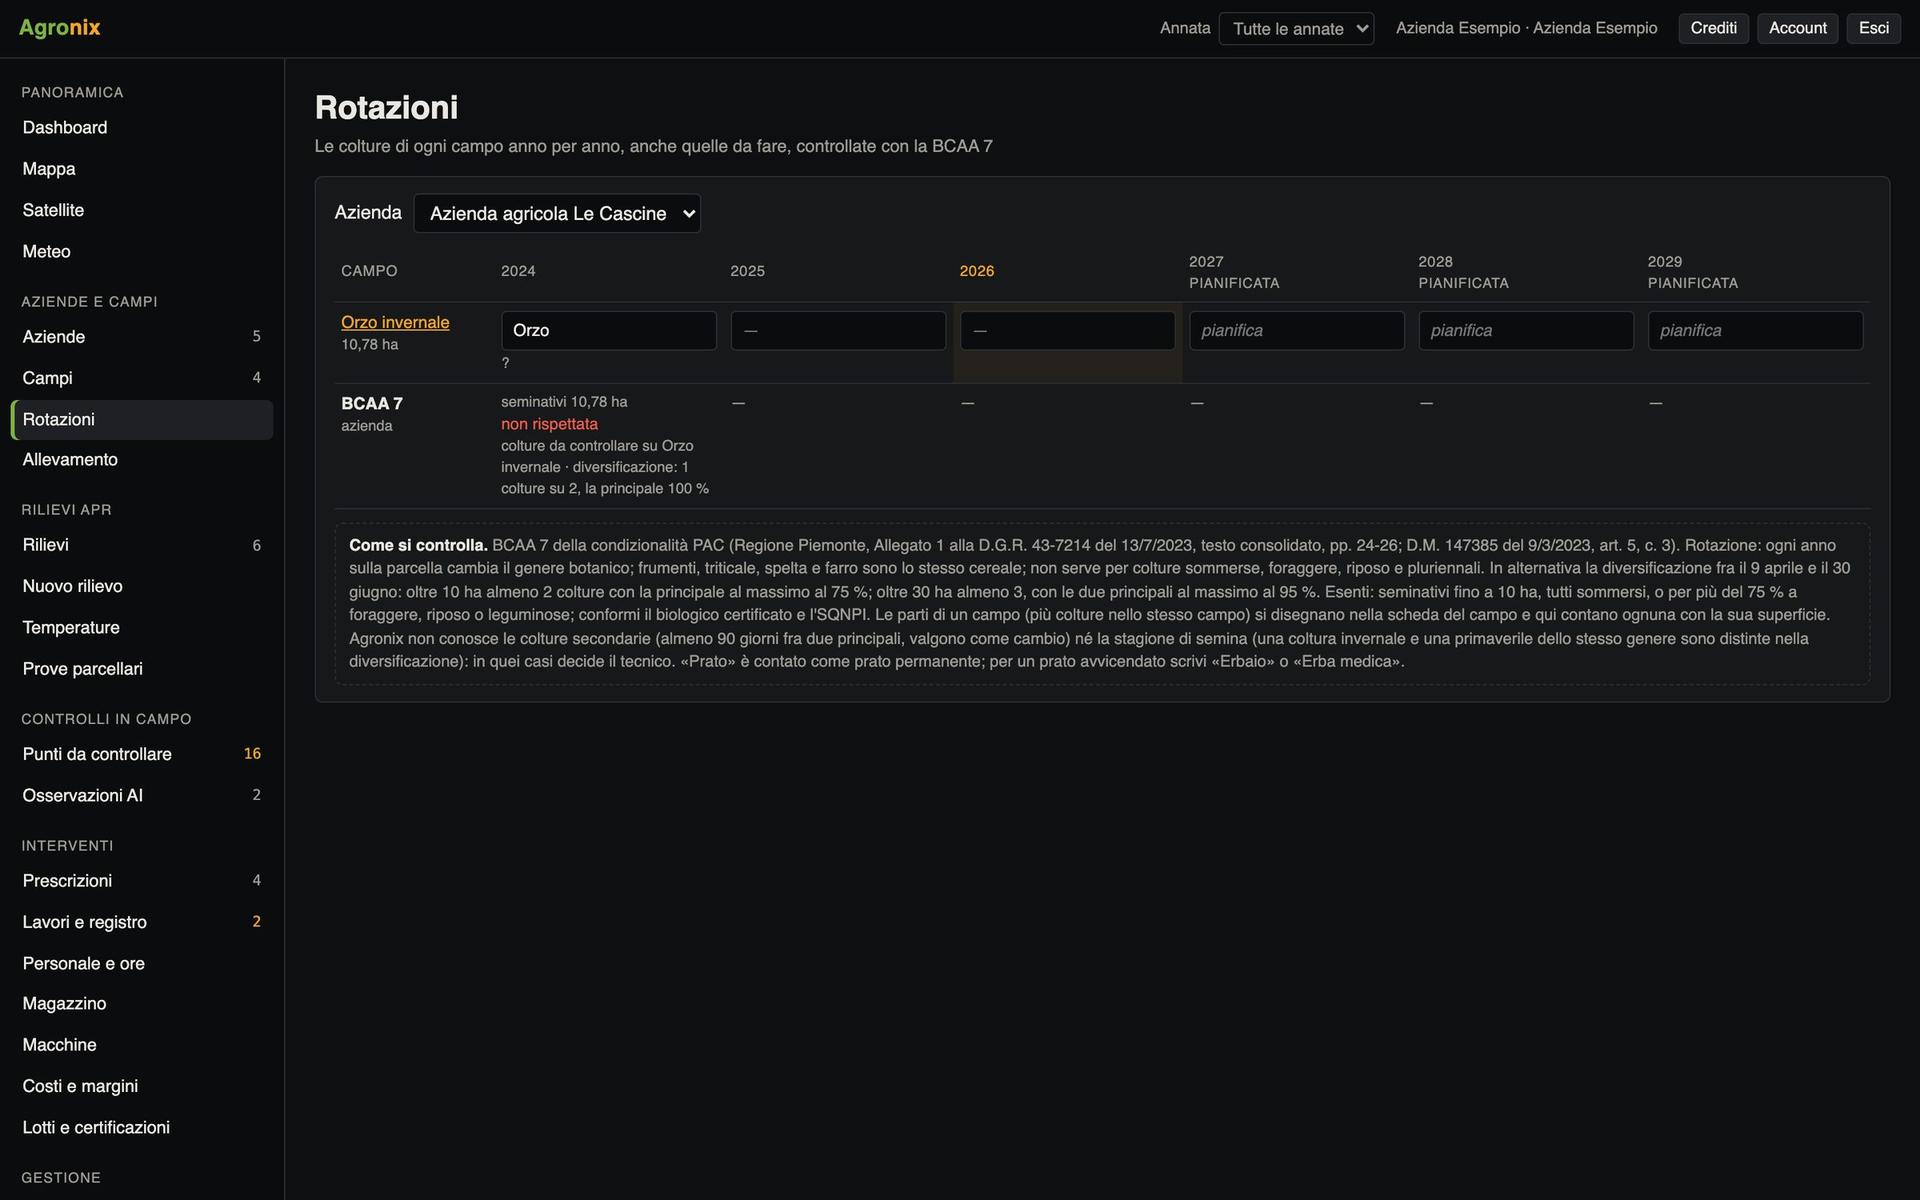
The crops of every field year by year, checked against GAEC 7. On the field page: cadastral parcels, Natura 2000 sites and nitrate vulnerable zones.
- Rotations planned three years ahead
- Manure nitrogen against the limit
- Warnings on treatments in protected sites
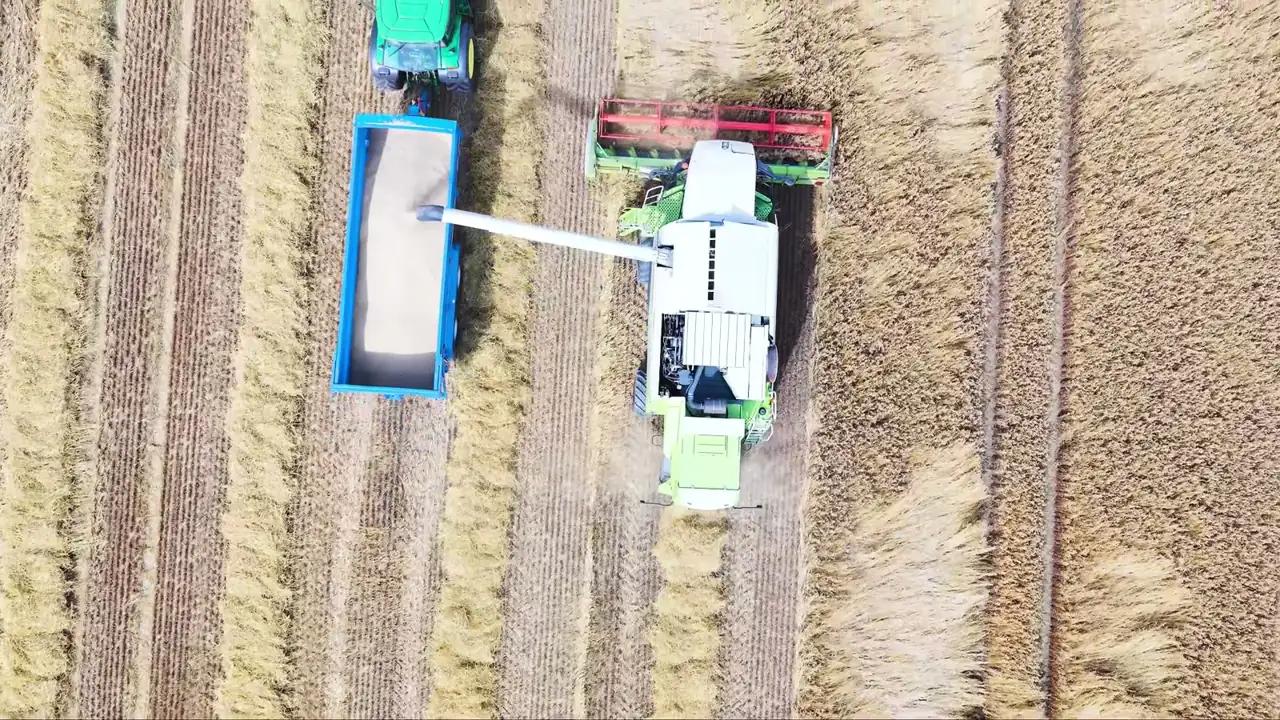
Farm management
Weather, stock, machines and costs
Everything needed to organise the work and know what every field earns.
Spray at the right time
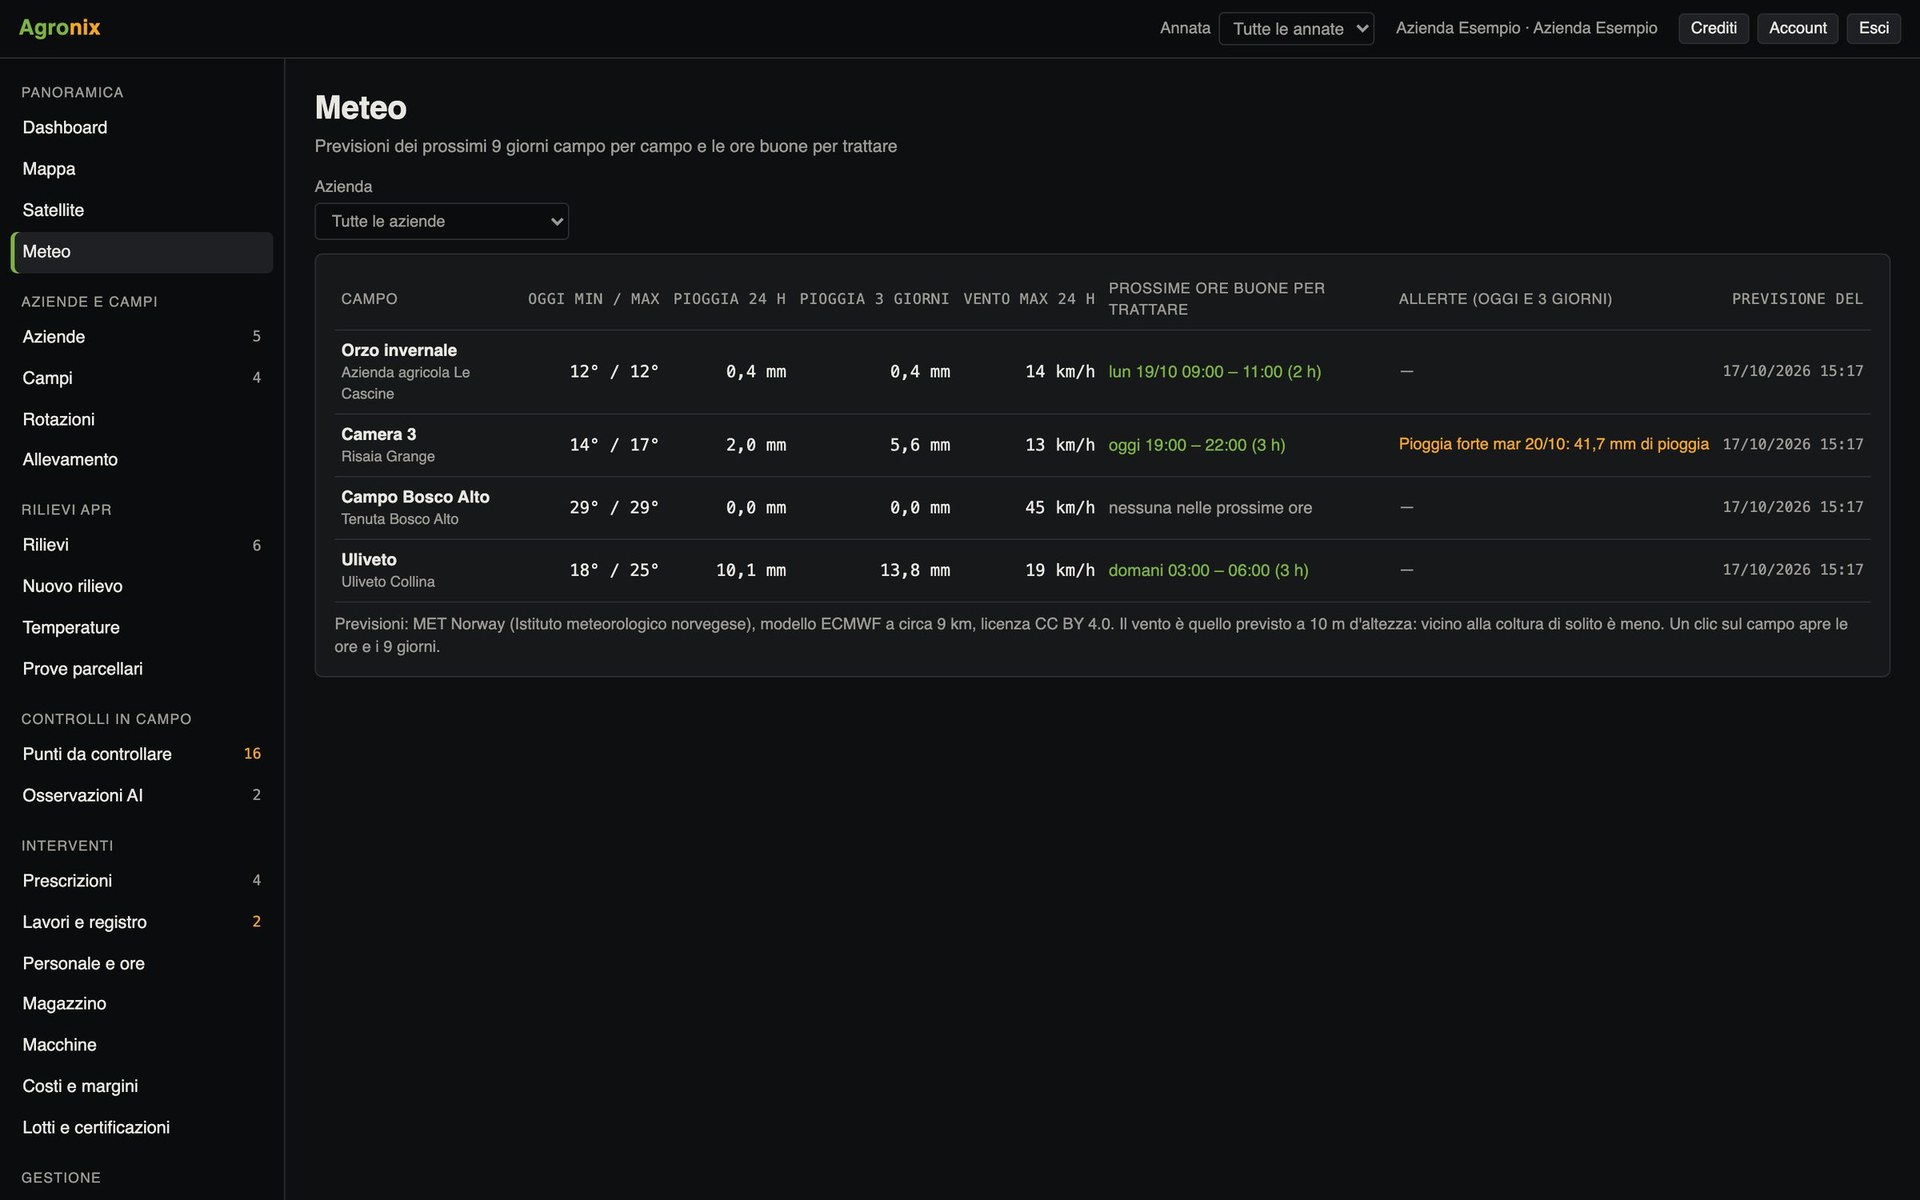
Nine-day forecasts field by field with the right hours to spray, based on wind and rain. Alerts for frost, strong wind and heat.
- Wind and rain hour by hour
- Rain in the hours after spraying
- History for every field
Never miss what happens
Maps ready, new points to check, observations to confirm, record and machine deadlines: in the app and by email, with thresholds chosen by each user.
- Personal temperature thresholds
- Falling vigour from satellite
- Work, inspections and licences due
24 features
All features
Every feature has its own page with app screens, how it works and the details.
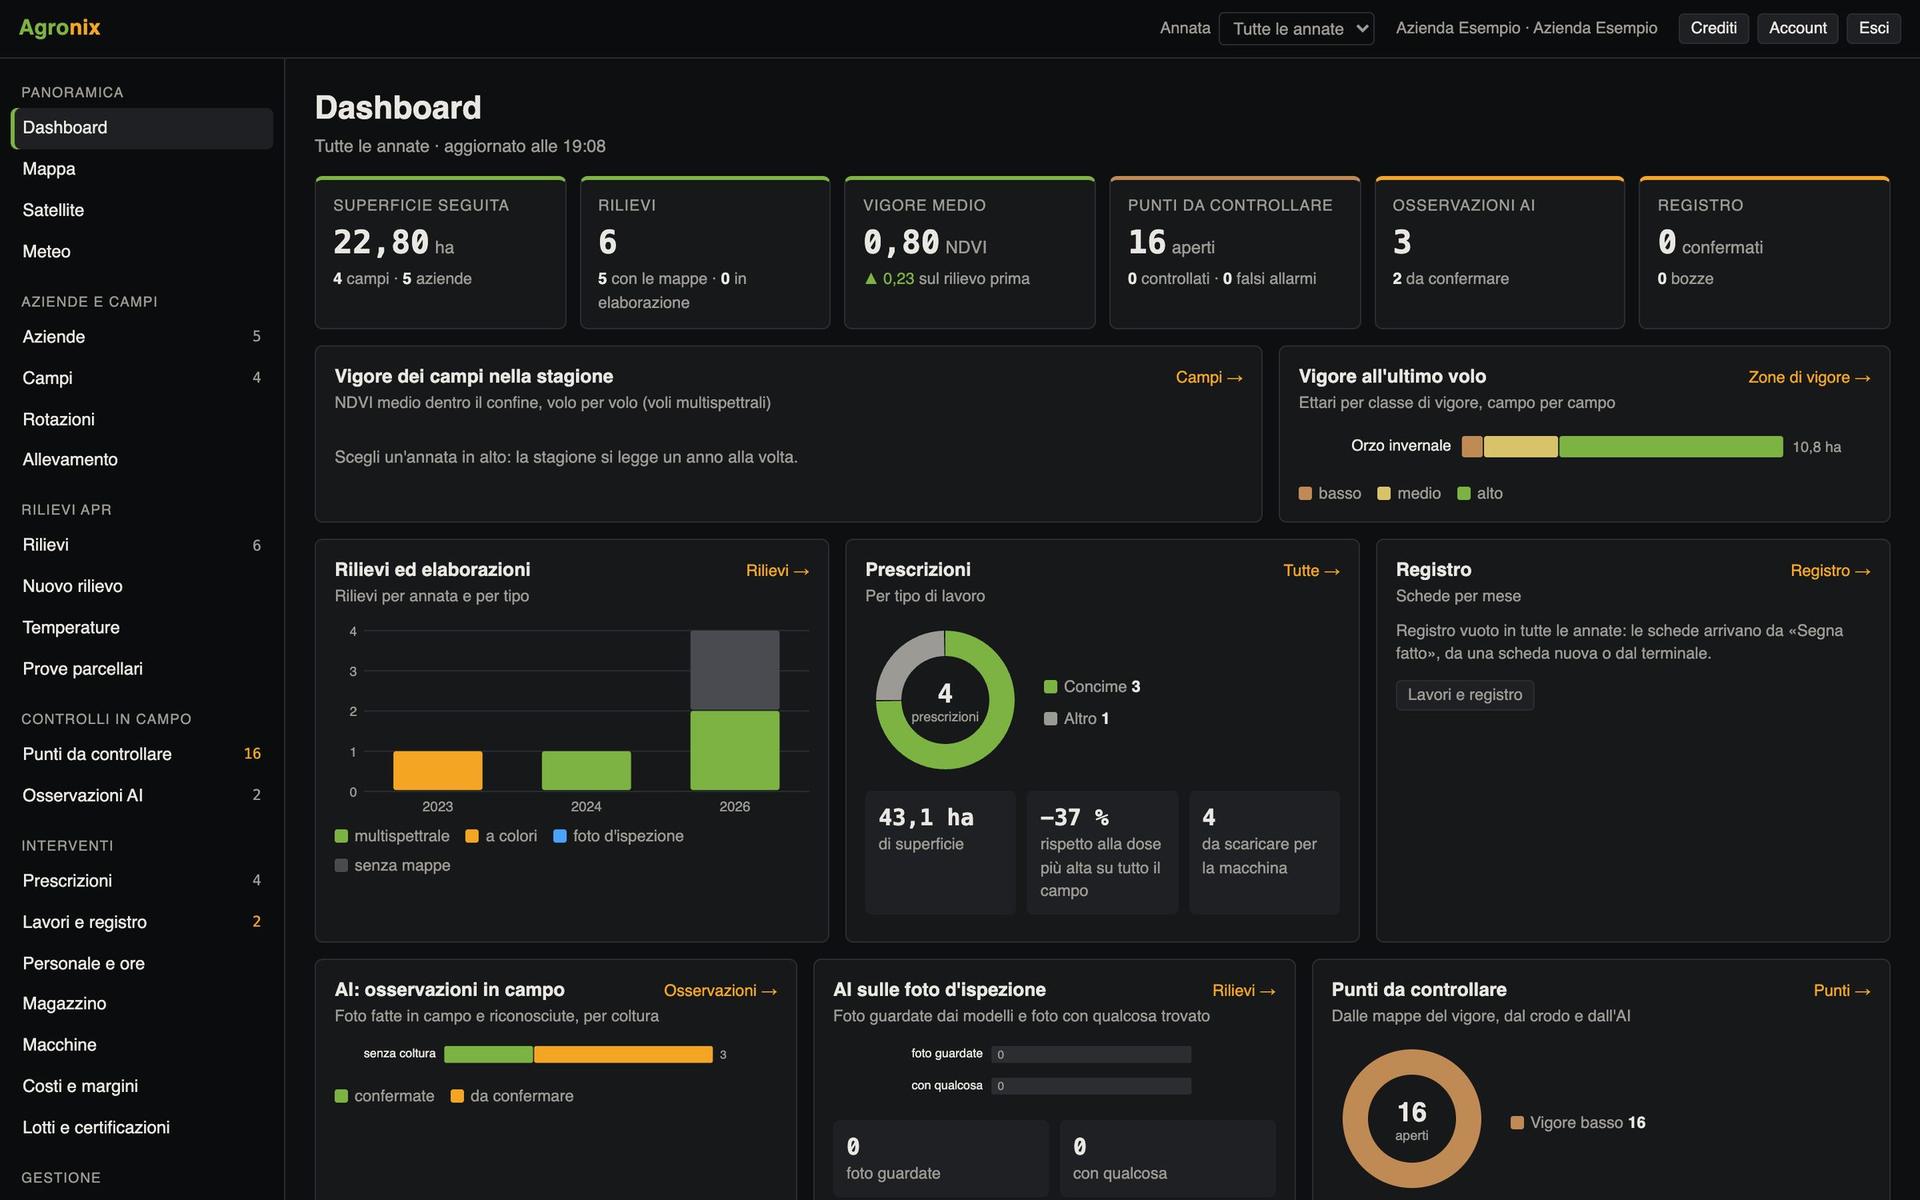
Overview
Dashboard and map
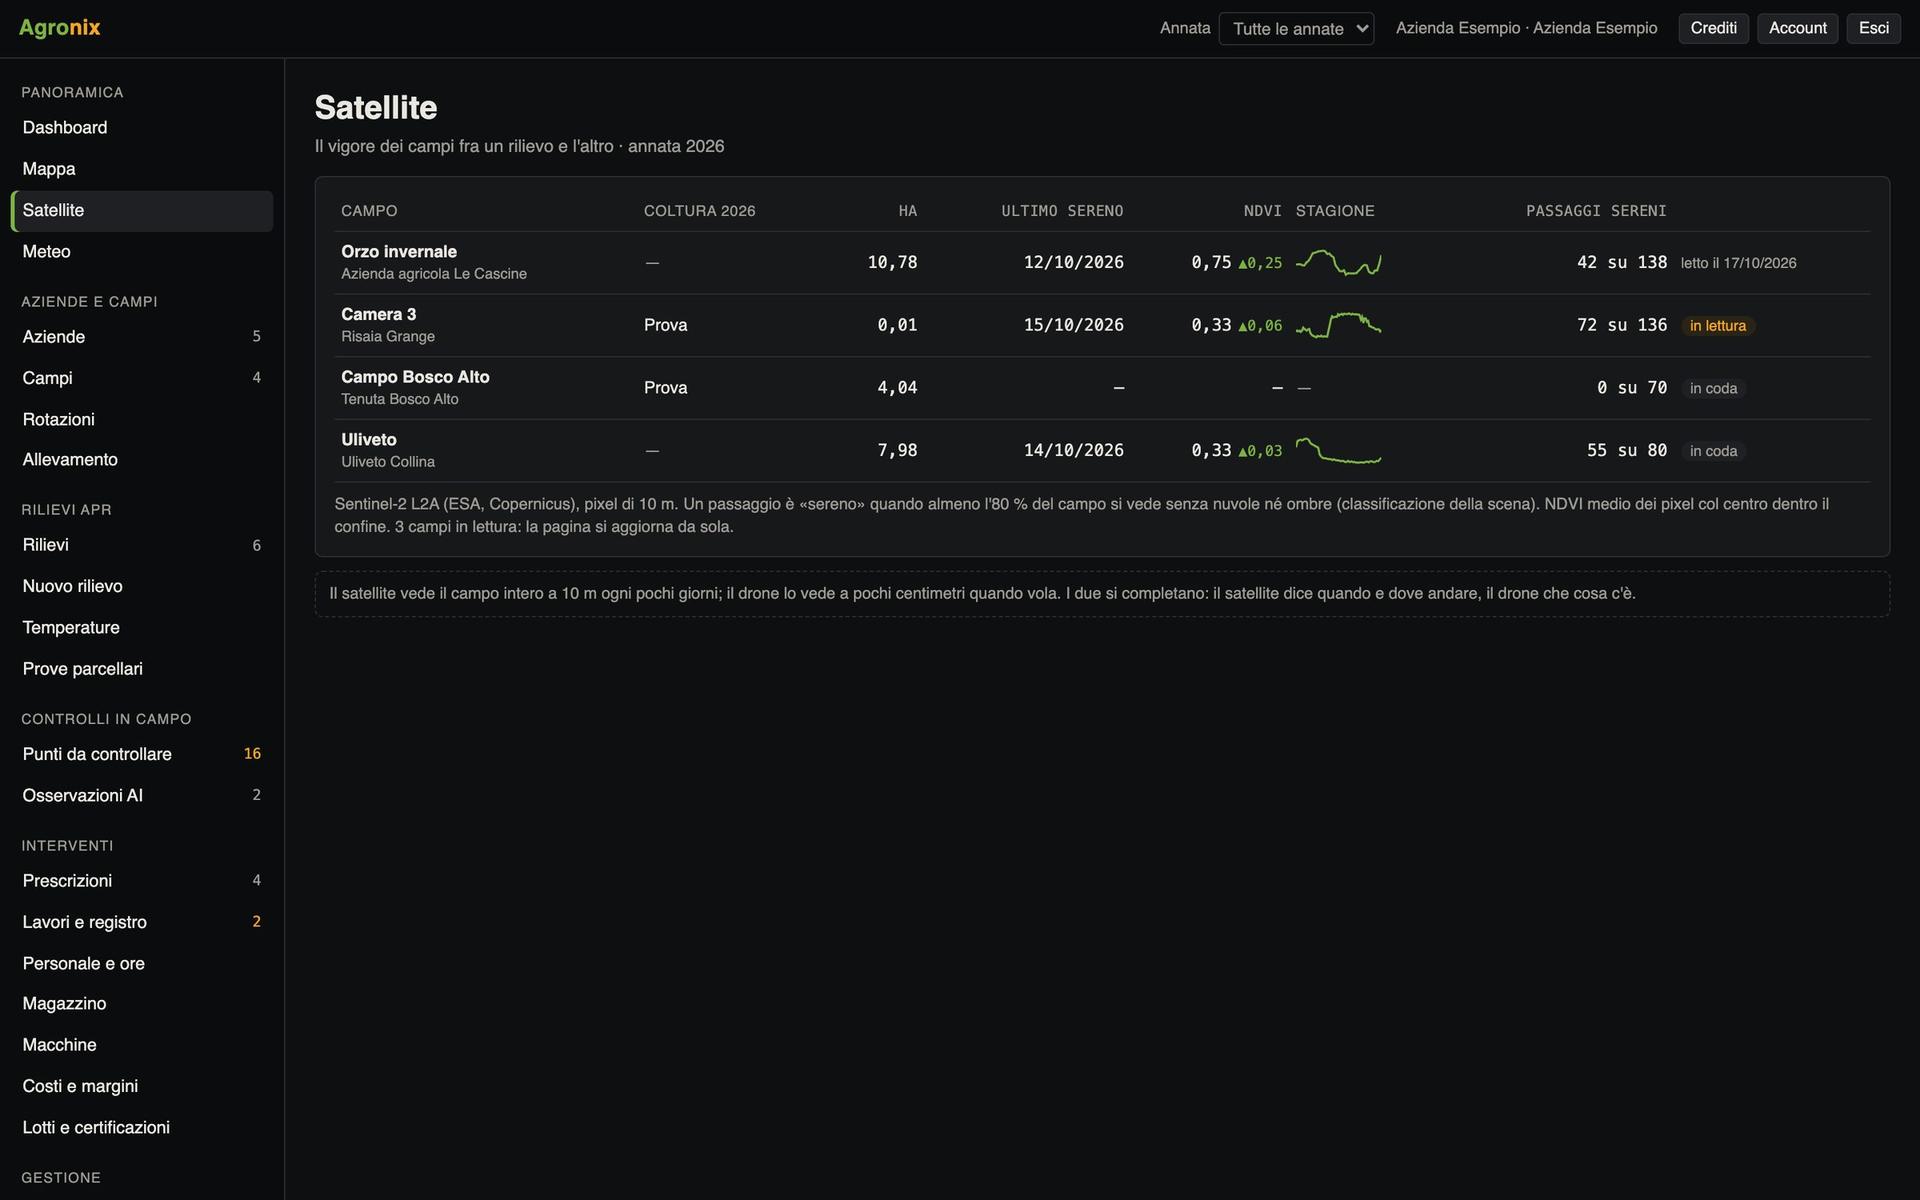
Overview
Satellite
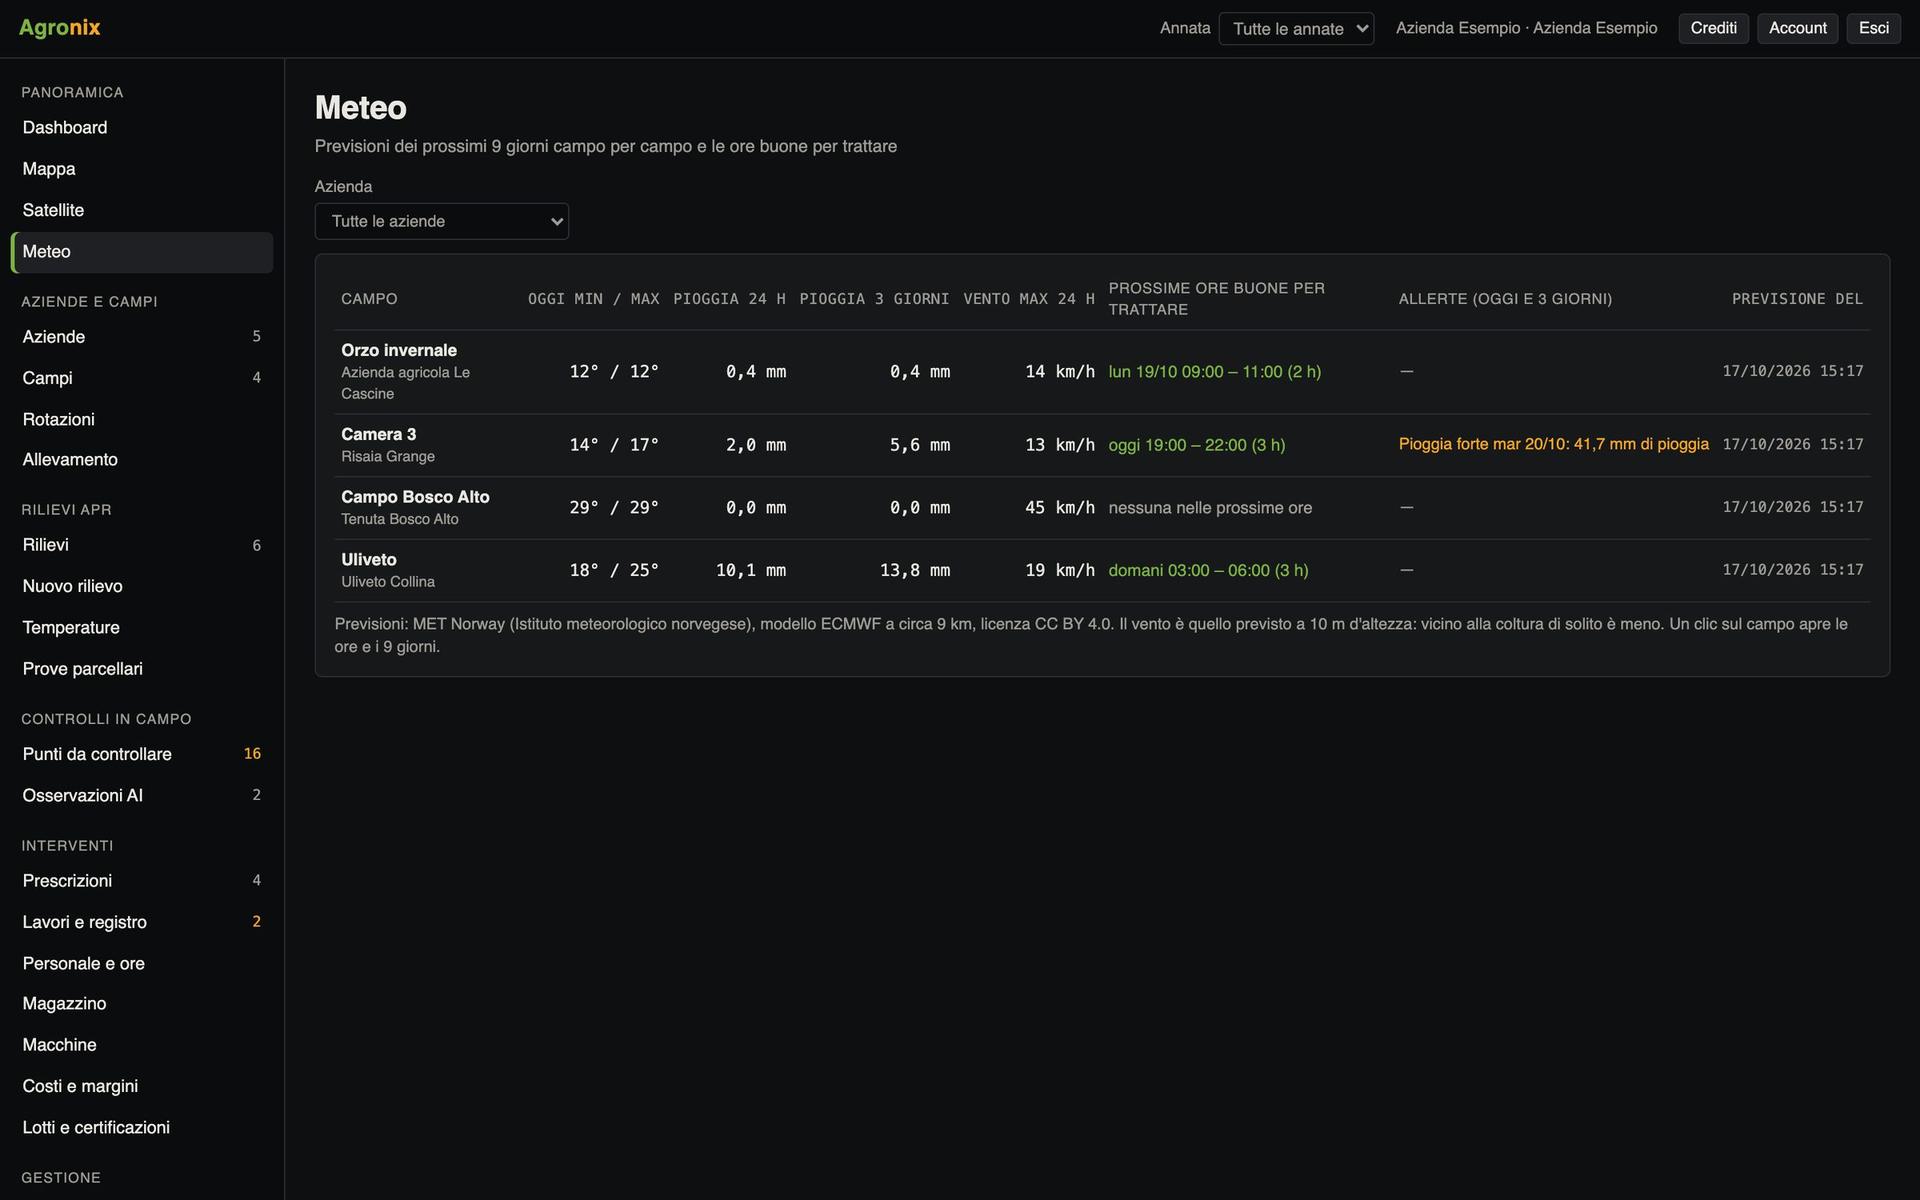
Overview
Weather and alerts
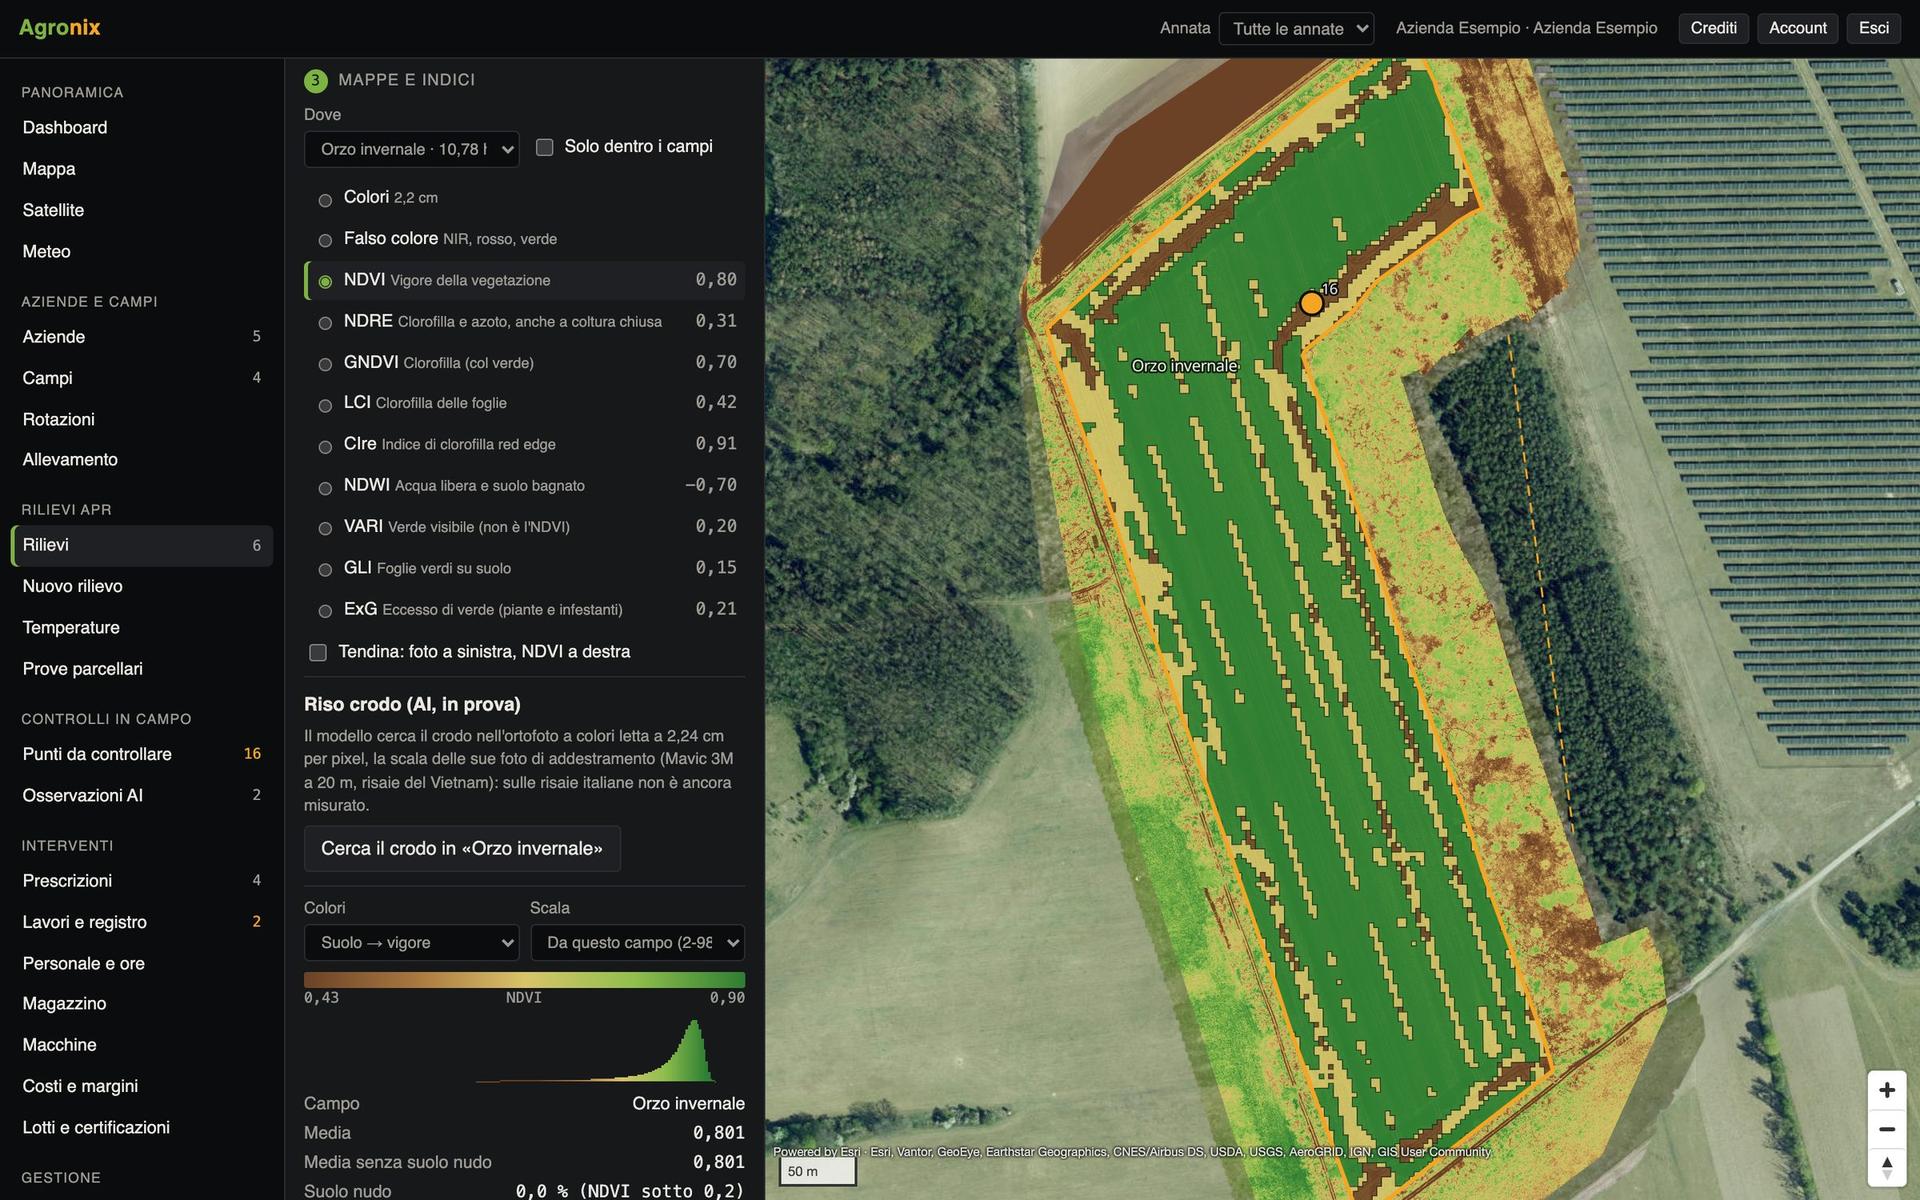
Drone surveys
Drone surveys
Drone surveys
Vigour maps and indices
Drone surveys
Temperatures
Drone surveys
Trees and heights
Drone surveys
Field trials
Fields and zones
Fields and season
Fields and zones
Vigour zones and yield
Field scouting
Points to check
Field scouting
Diseases and pests
Operations and machines
Prescriptions
Operations and machines
Machine files
Operations and machines
Jobs and staff
Operations and machines
Stock
Operations and machines
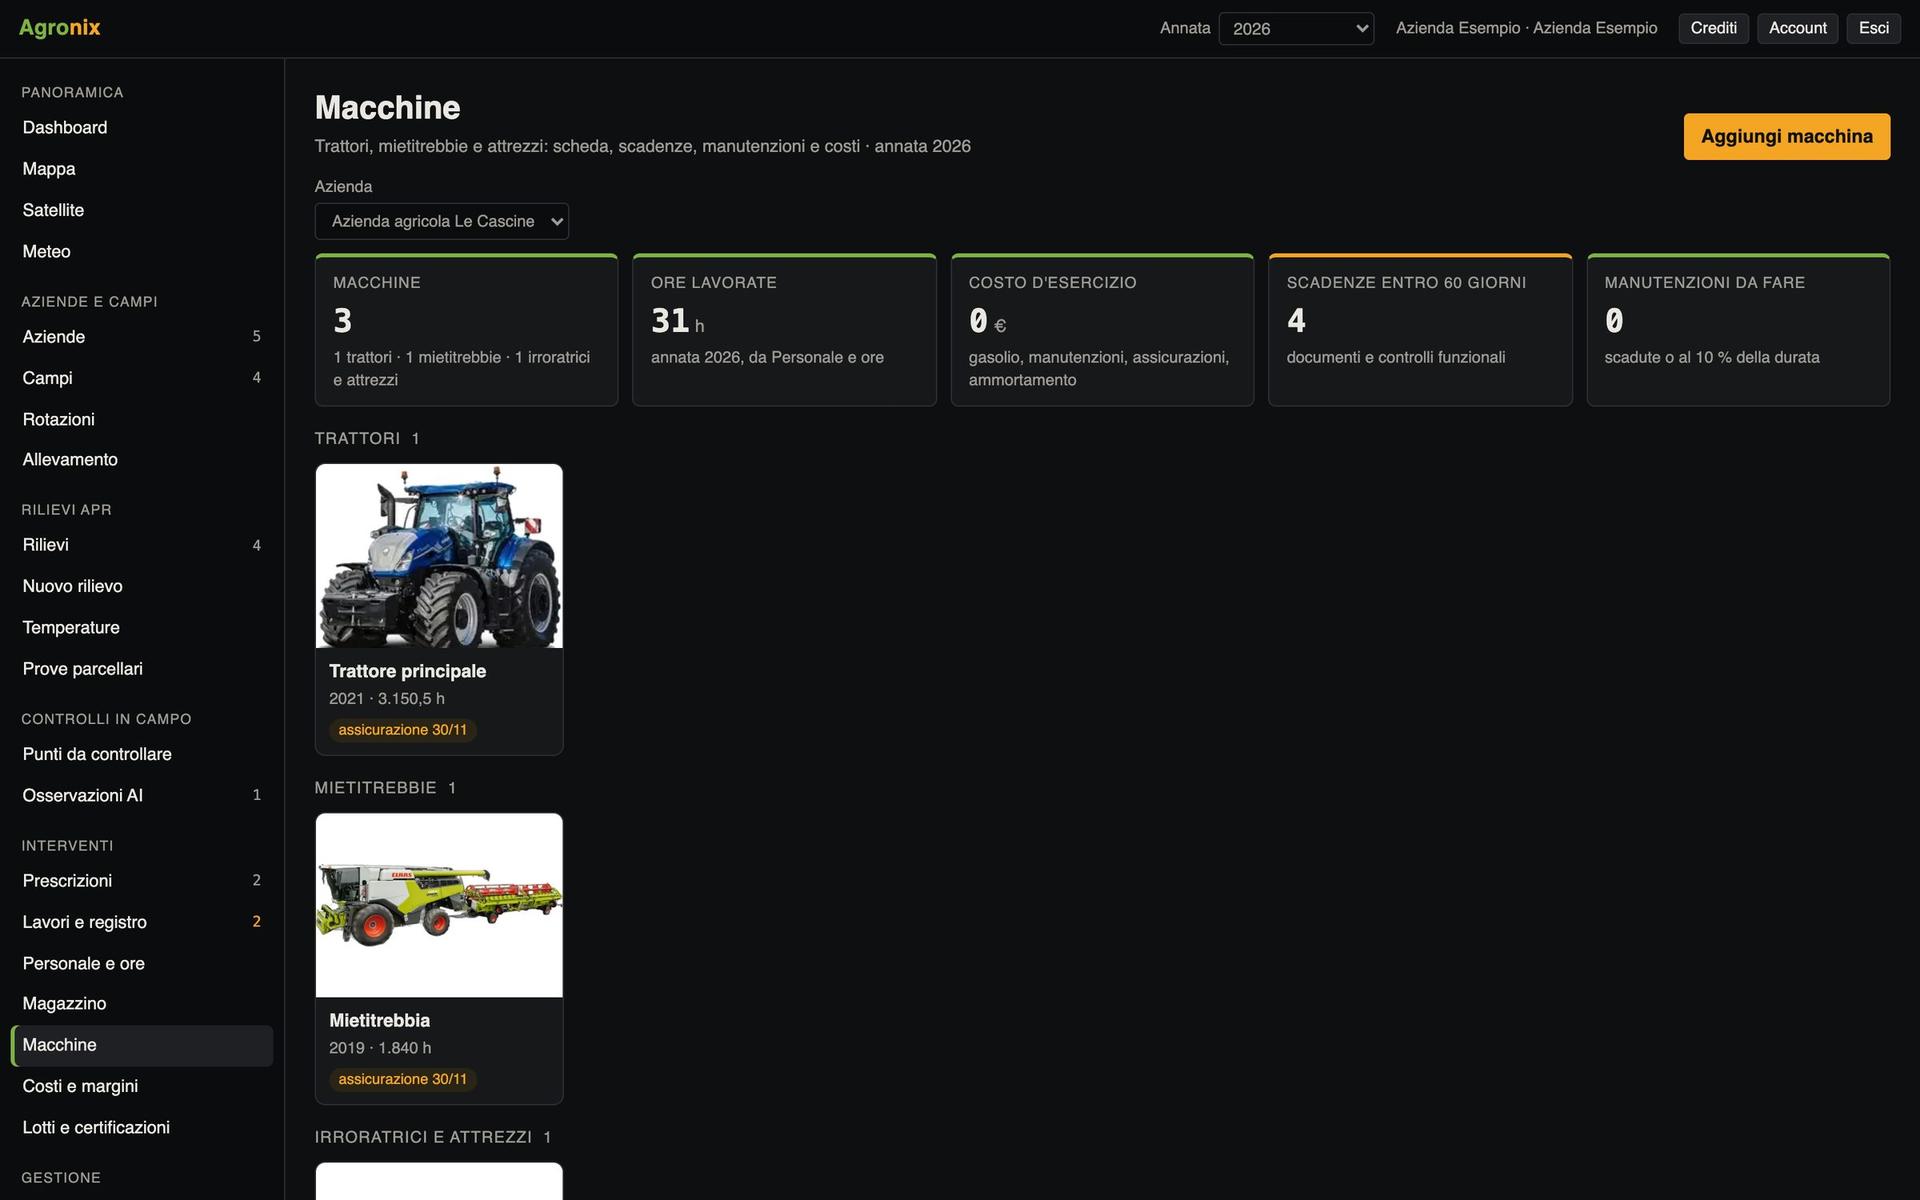
Machines
Operations and machines
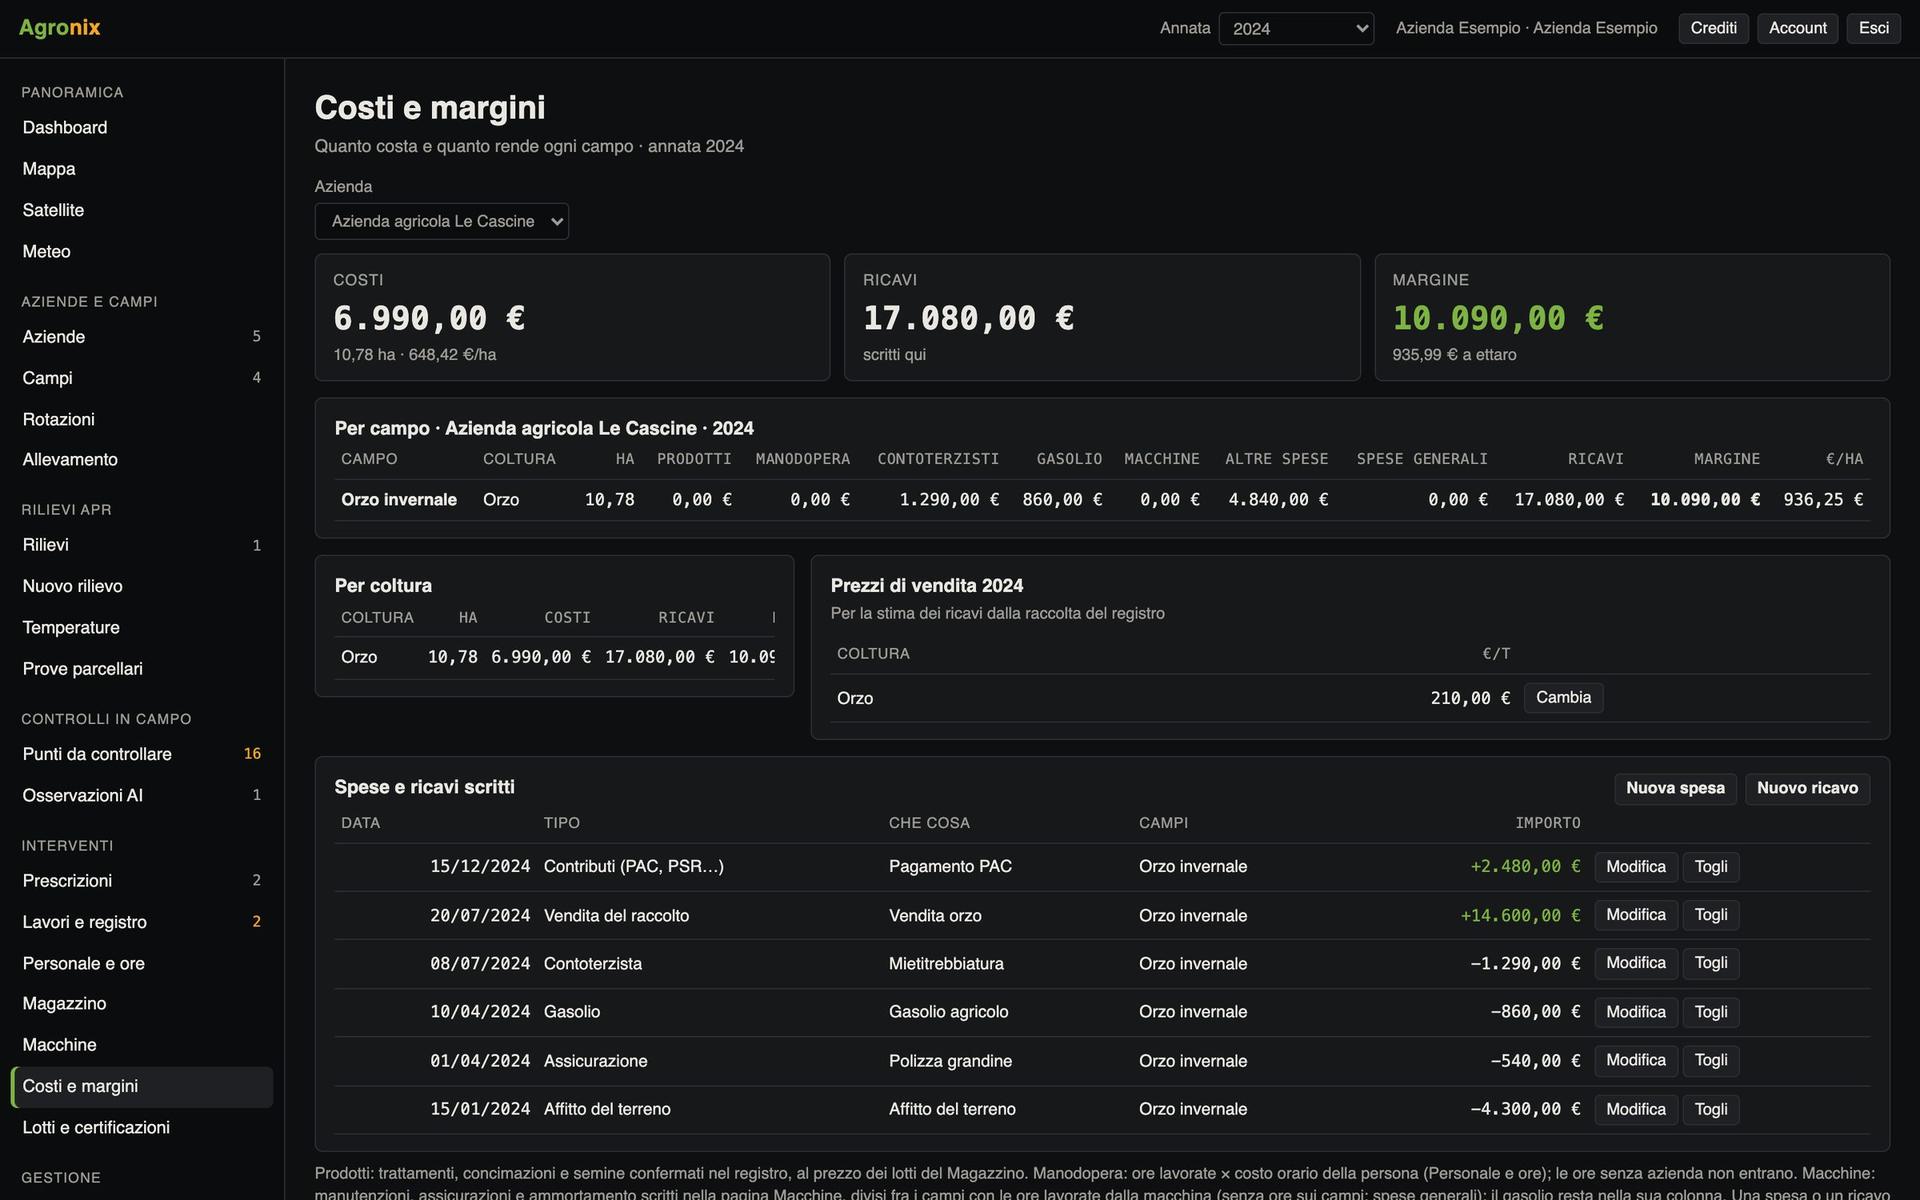
Costs and margins
Records and compliance
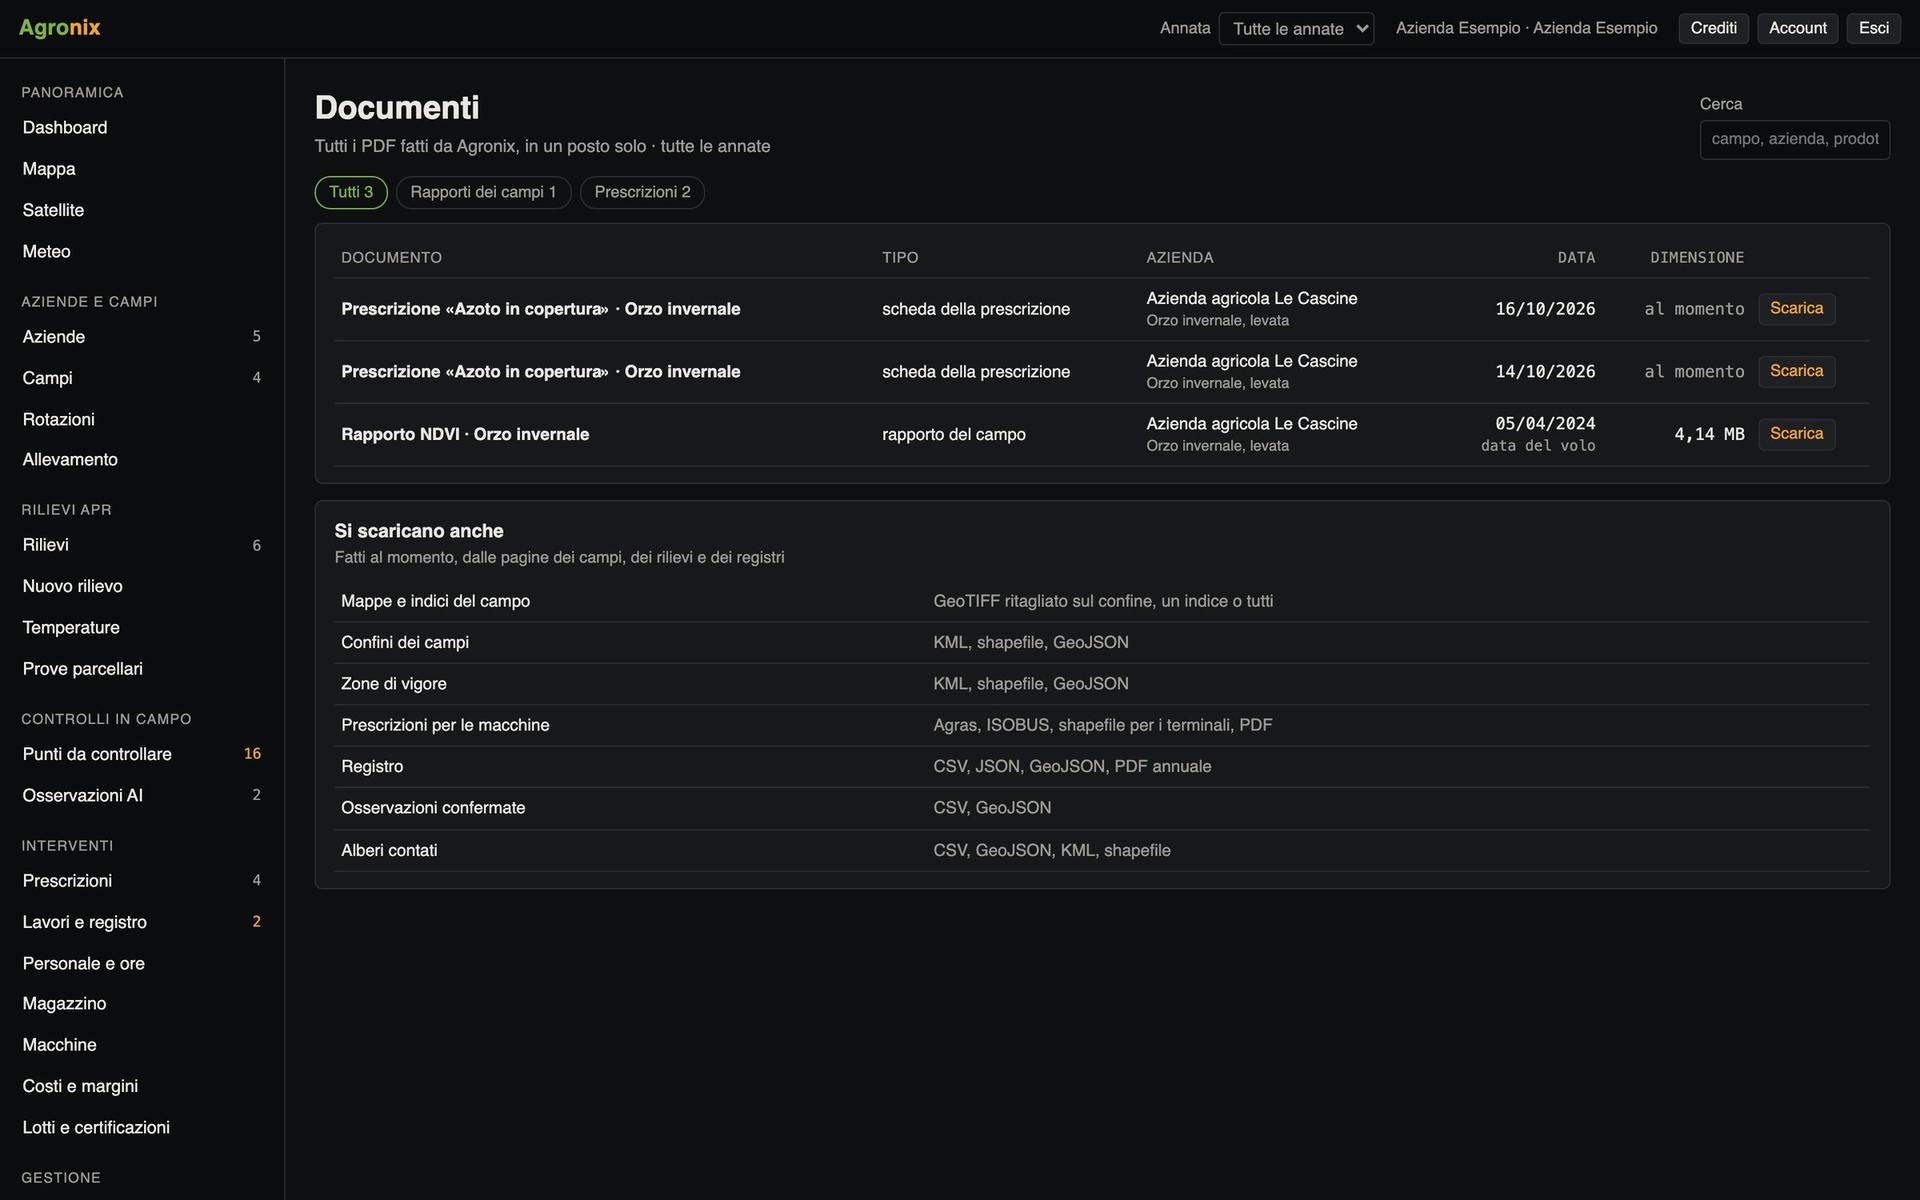
Records and logbook
Records and compliance
Environment and conditionality
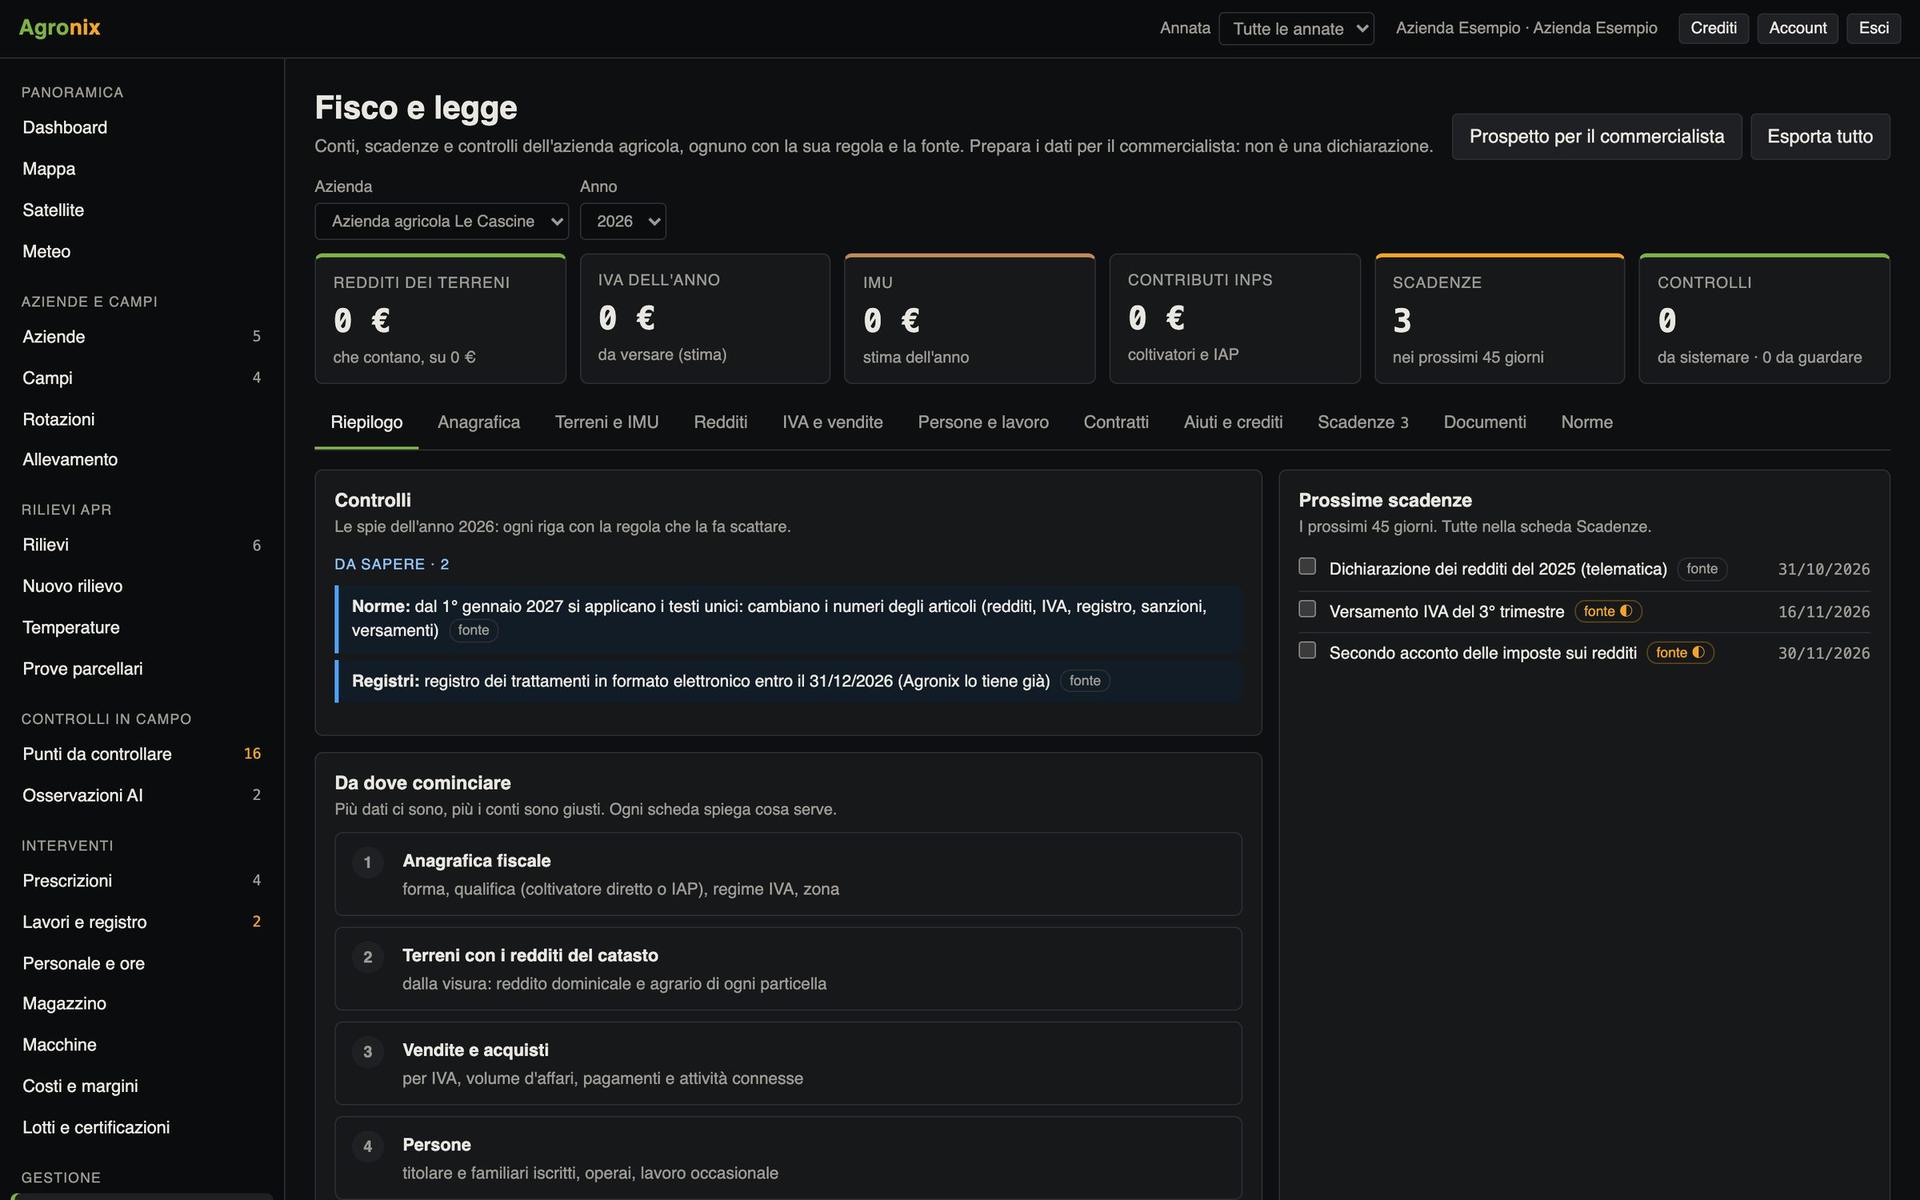
Records and compliance
Tax and compliance
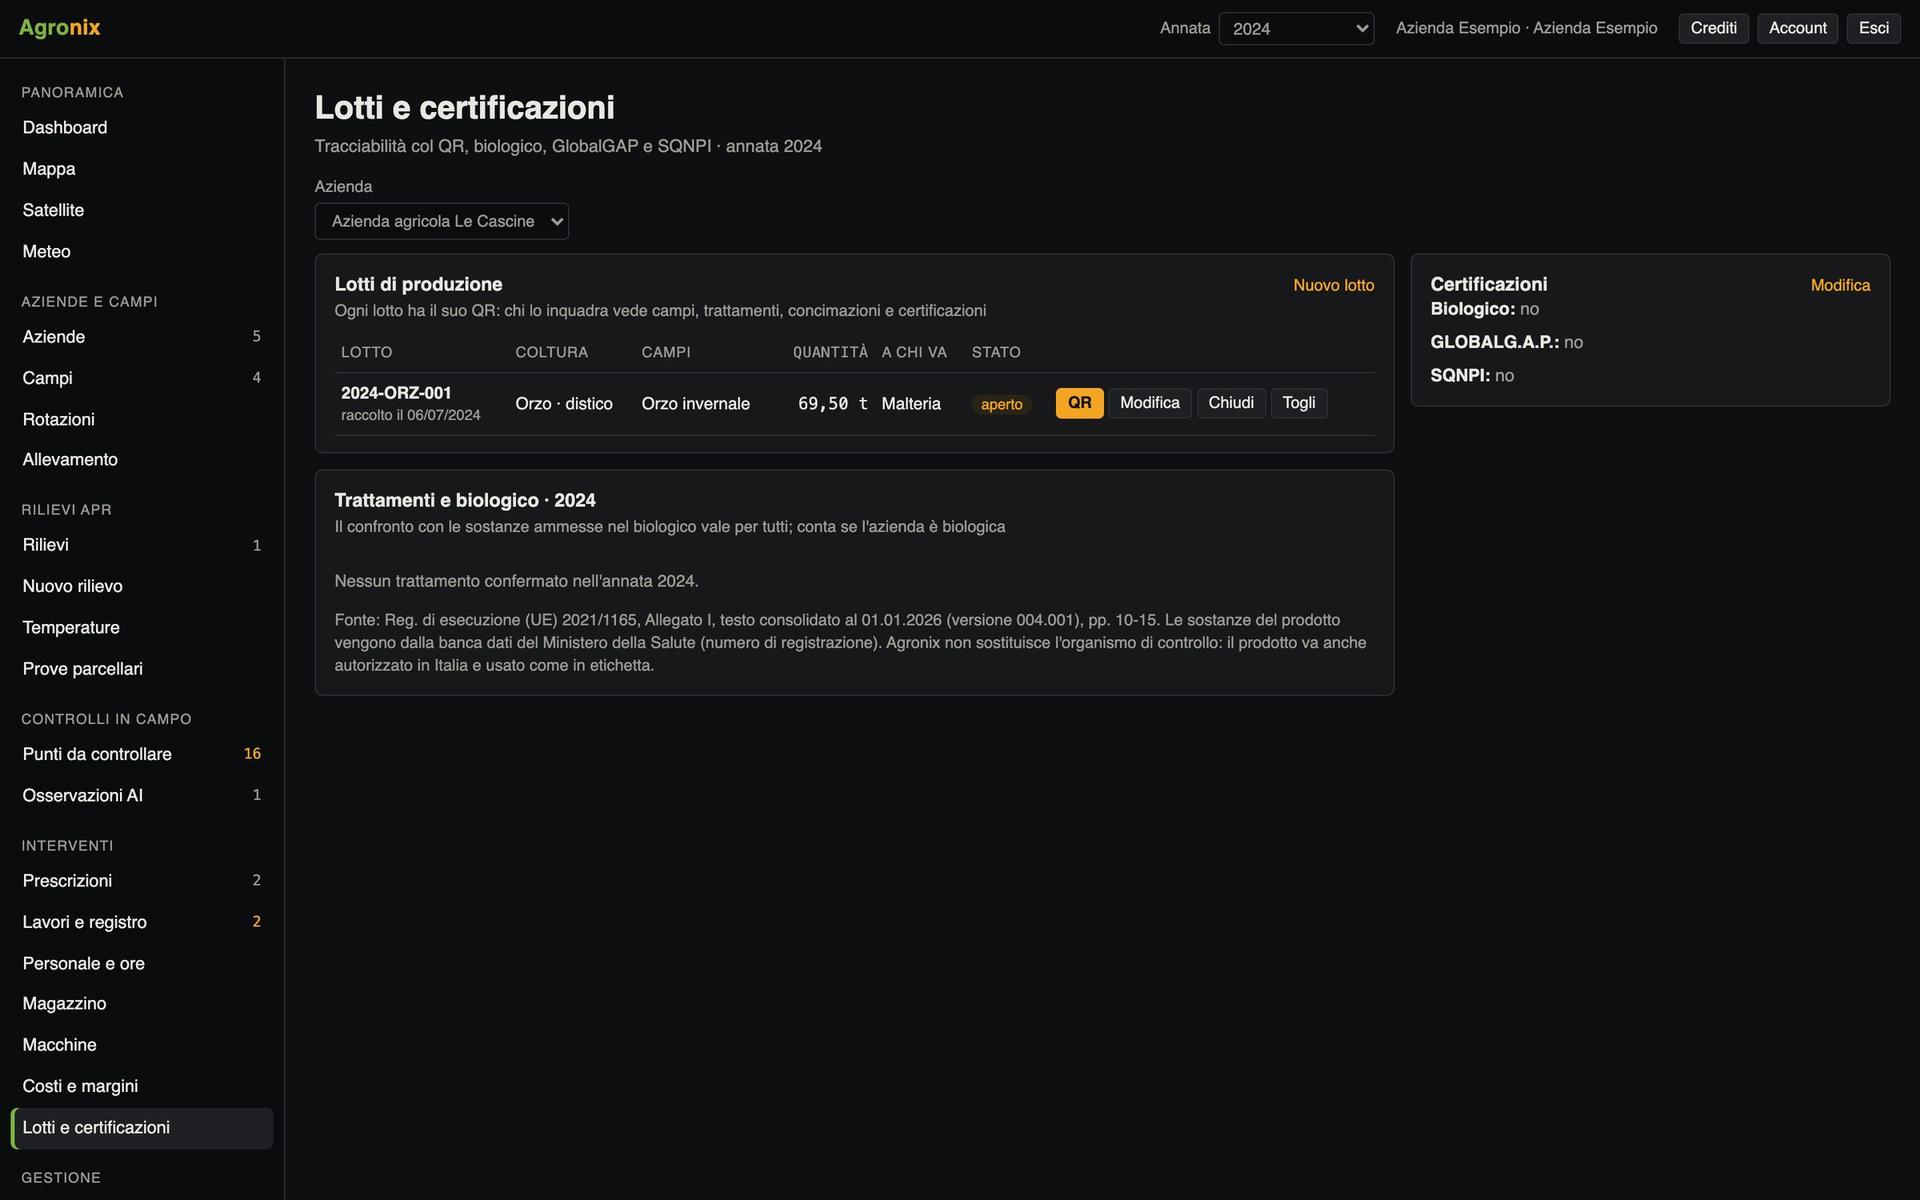
Traceability and supply chain
Lots and certifications
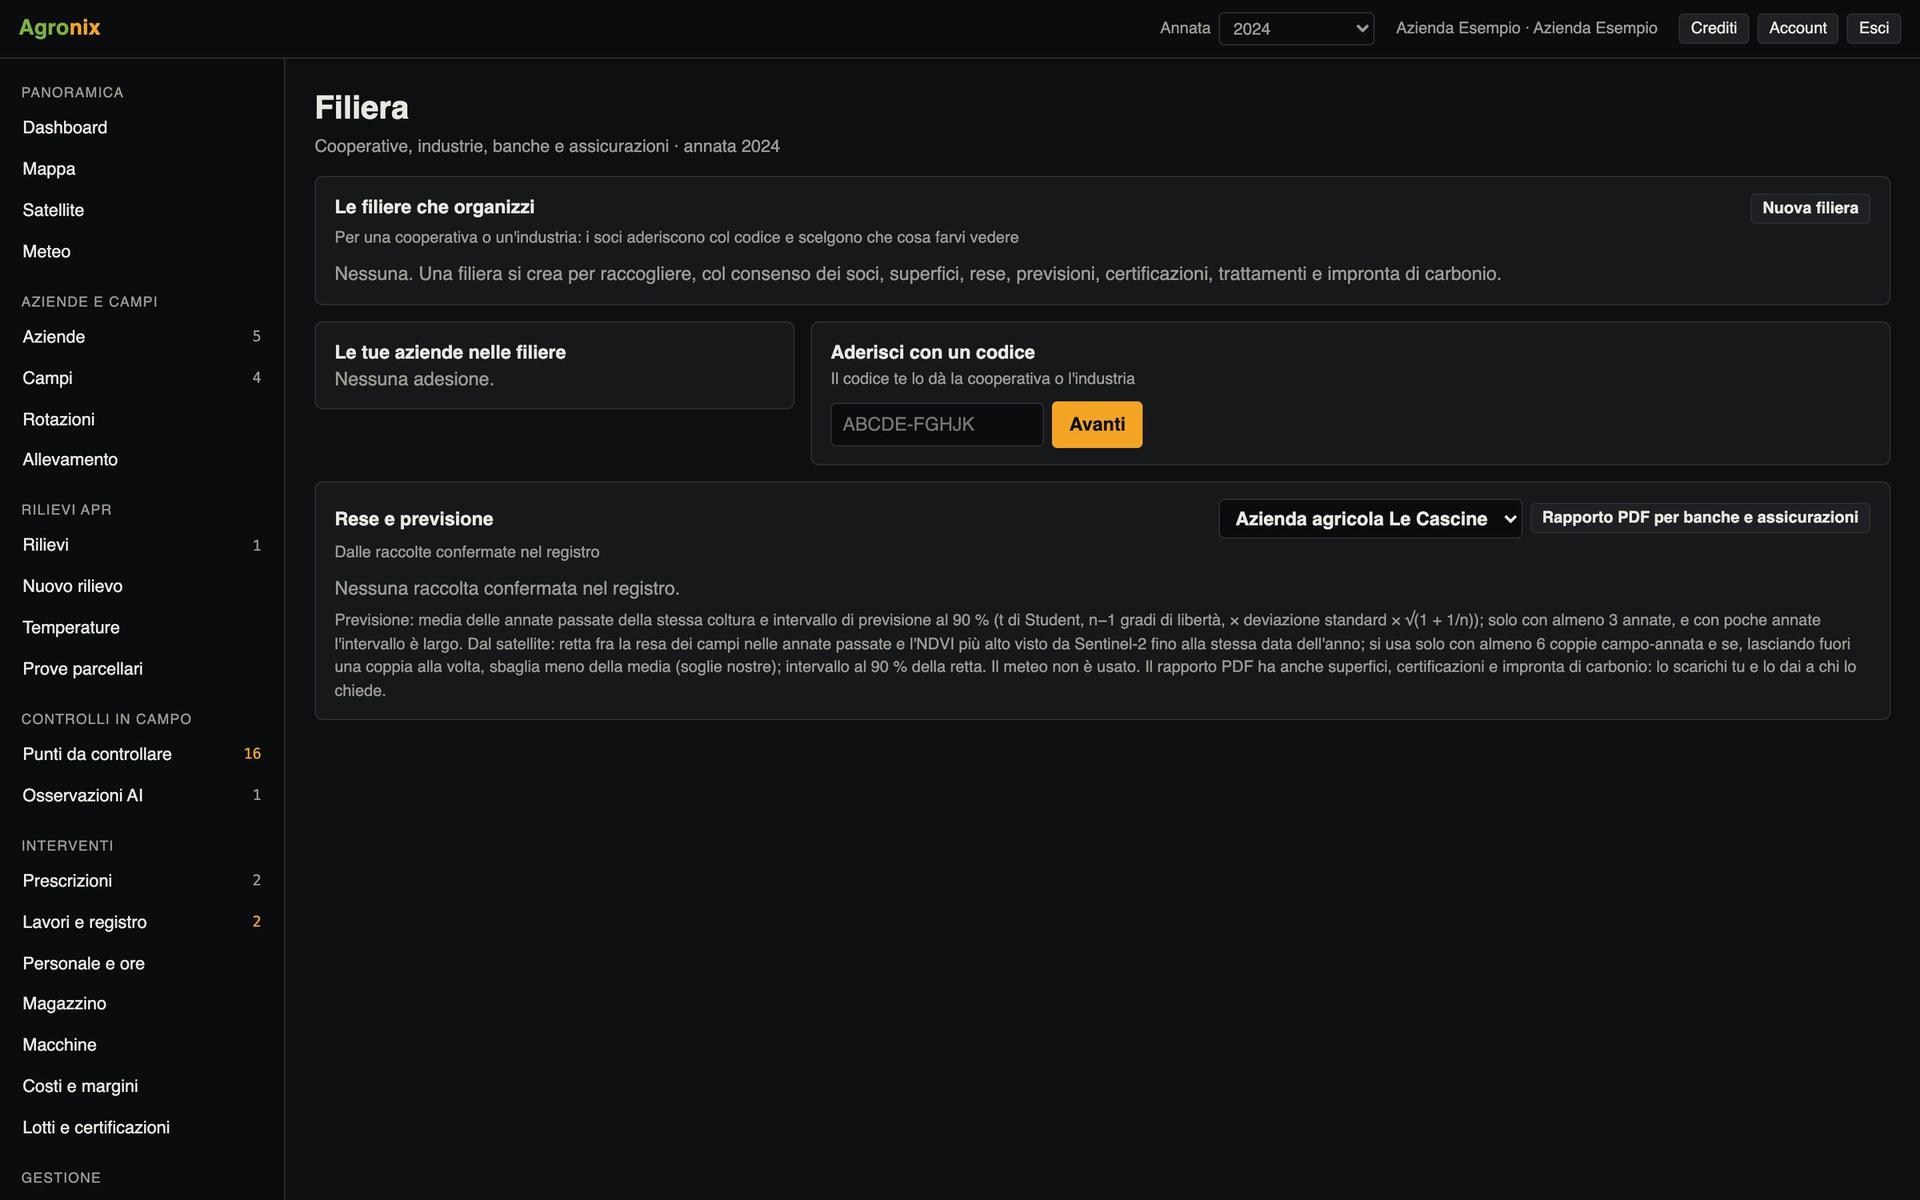
Traceability and supply chain
Supply chain and yields
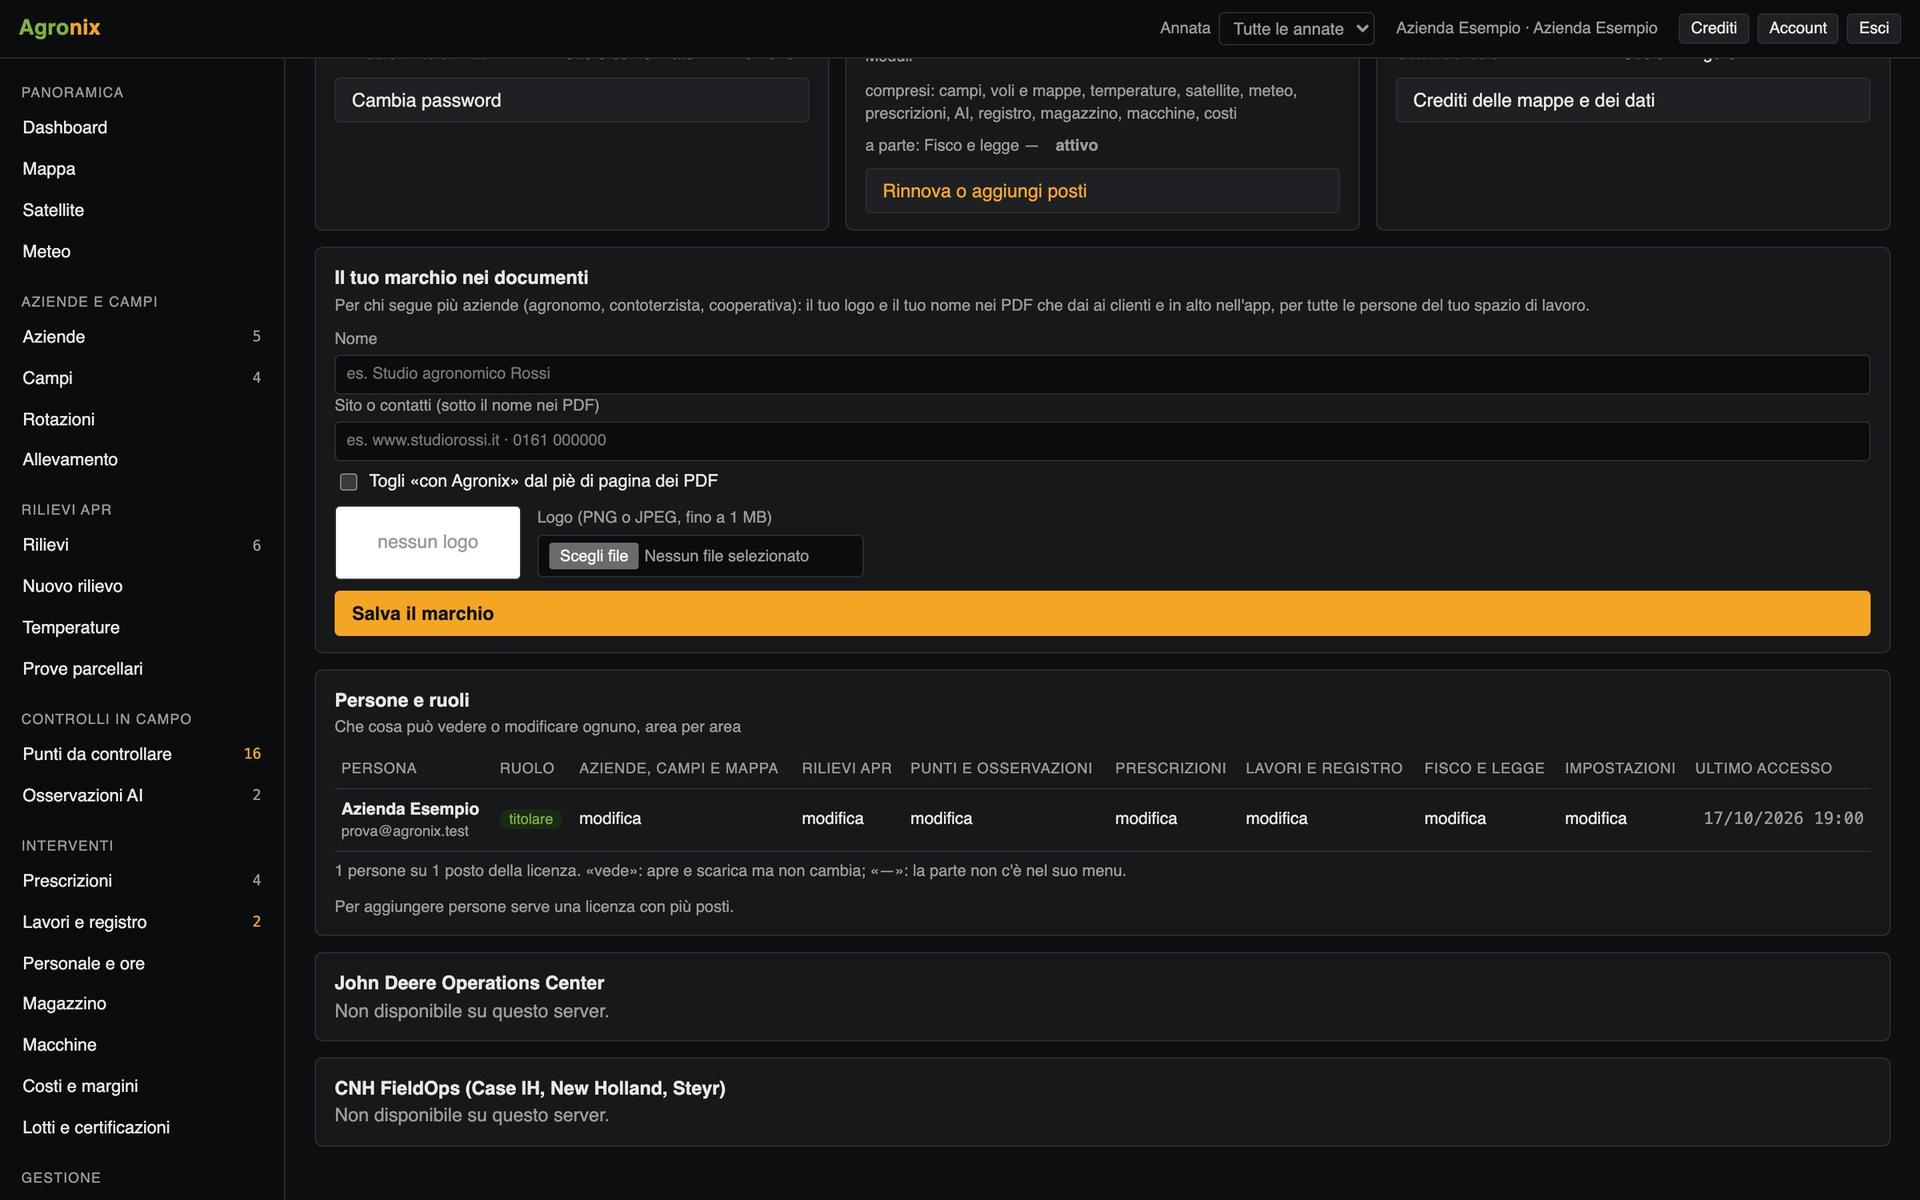
Administration
People, roles and branding
Computer, tablet and phone
Opens in the browser, anywhere
Nothing to install: Agronix runs on computer and tablet with every feature, on the phone with what you need in the field. The data is the same, updated for everyone.
Why Agronix
Servers in Europe
Processing and data stay on European servers.
Your data stays yours
Everything downloads in open formats: GeoTIFF, shapefile, KML, CSV, ISOXML.
Italian and EU rules
Records, conditionality, nitrate zones and crop protection notices built in.
Built by people who fly
Developed by Pixel Air, which carries out drone surveys in Piedmont.
Want to see Agronix on your fields?
A demo on a real survey, from flight to prescription.