Fields and season
Every field with its history
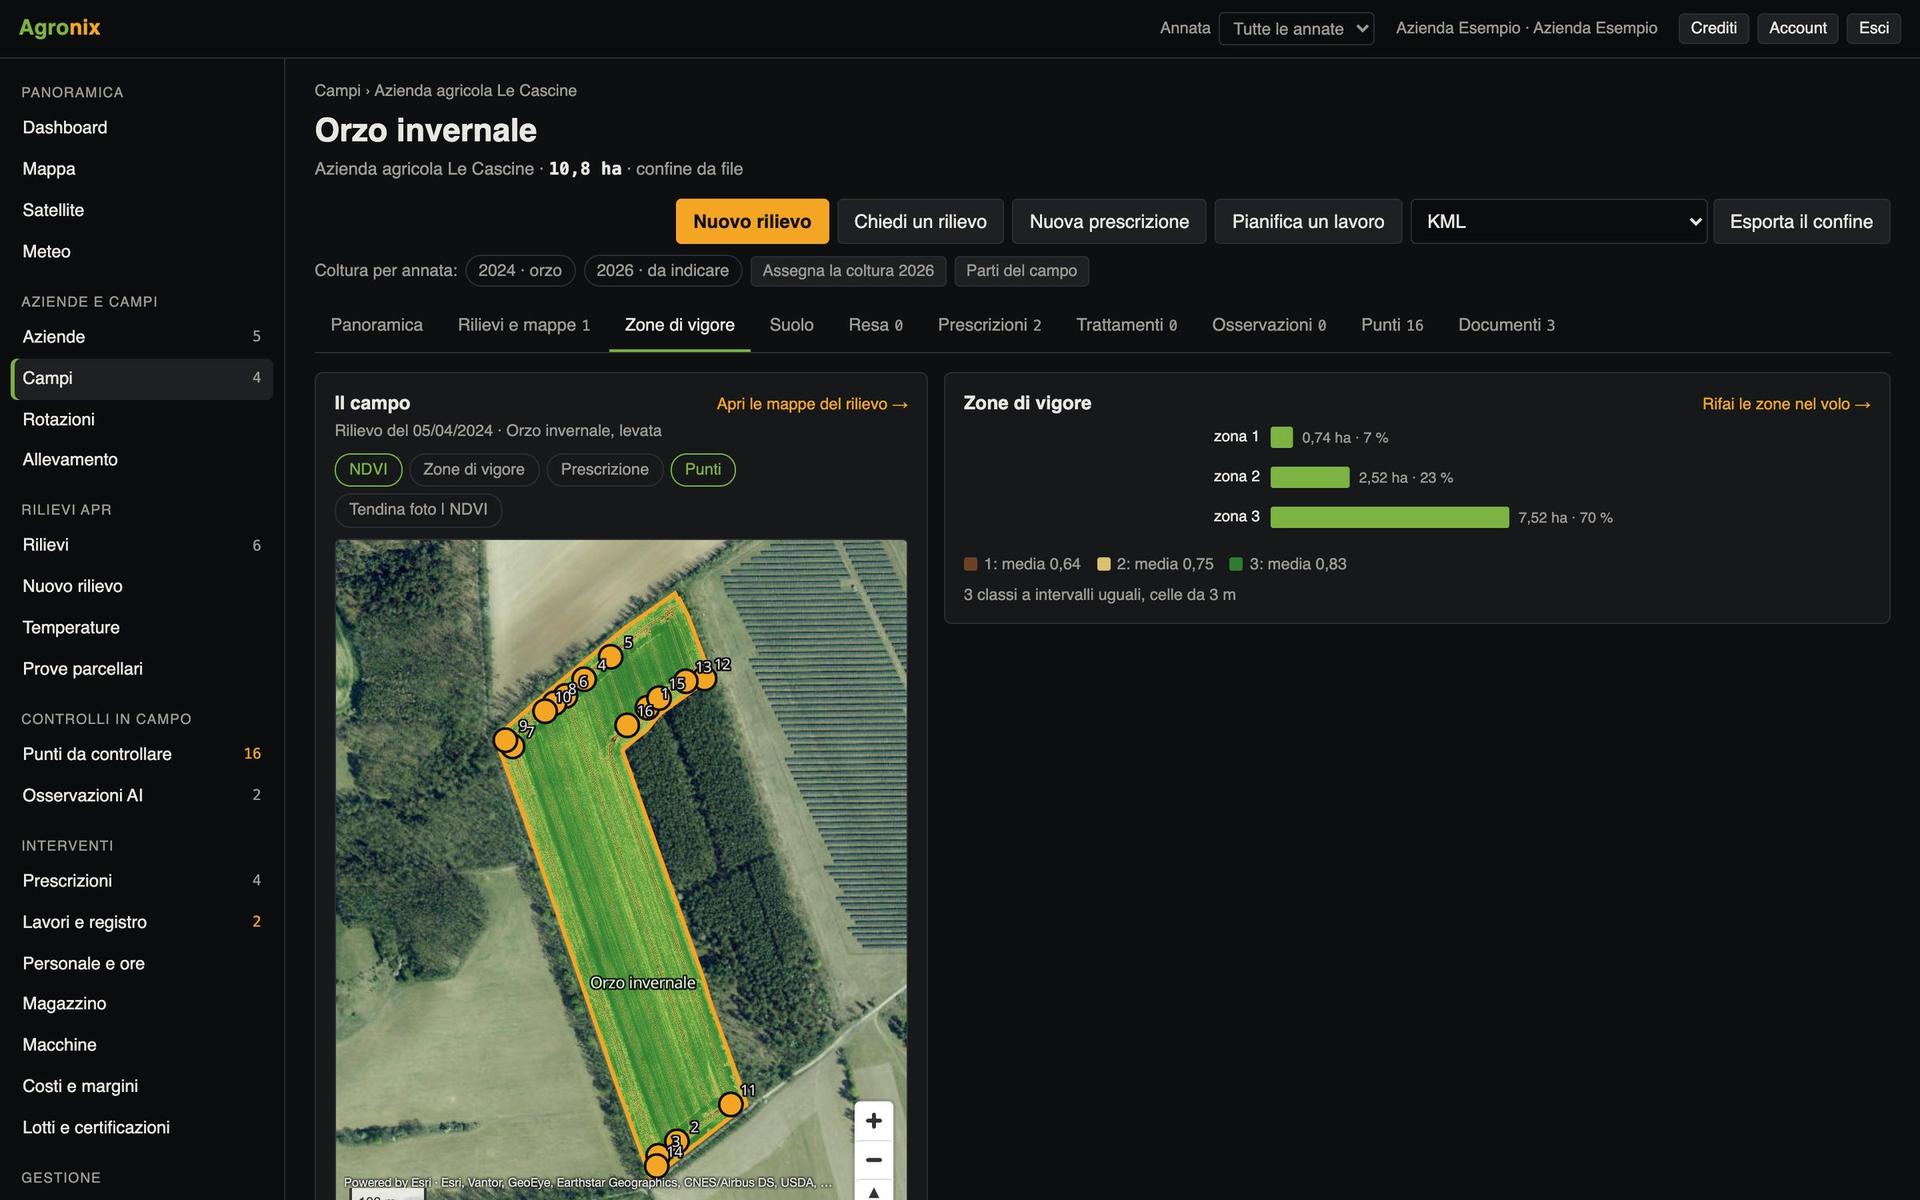
Boundaries drawn or imported, crop season by season, cadastral parcels, soil analyses, surveys, satellite, zones, prescriptions and weather on the field page.
In Agronix everything starts from the field. Draw the boundary on the map or import it from files you already have, and from there the field page gathers everything: the crop of every season, drone surveys and satellite passes, zones, prescriptions, treatments, cadastral parcels under the boundary and soil analyses. One page to know what happened and what to do.
Follow the season in one chart
At the top the latest survey, vigour, prescriptions and points to check; below the date strip with surveys and satellite passes, the map with the slider, the season curve and the coming days' weather. The other tabs of the field lead to surveys and maps, zones, prescriptions, soil and documents.
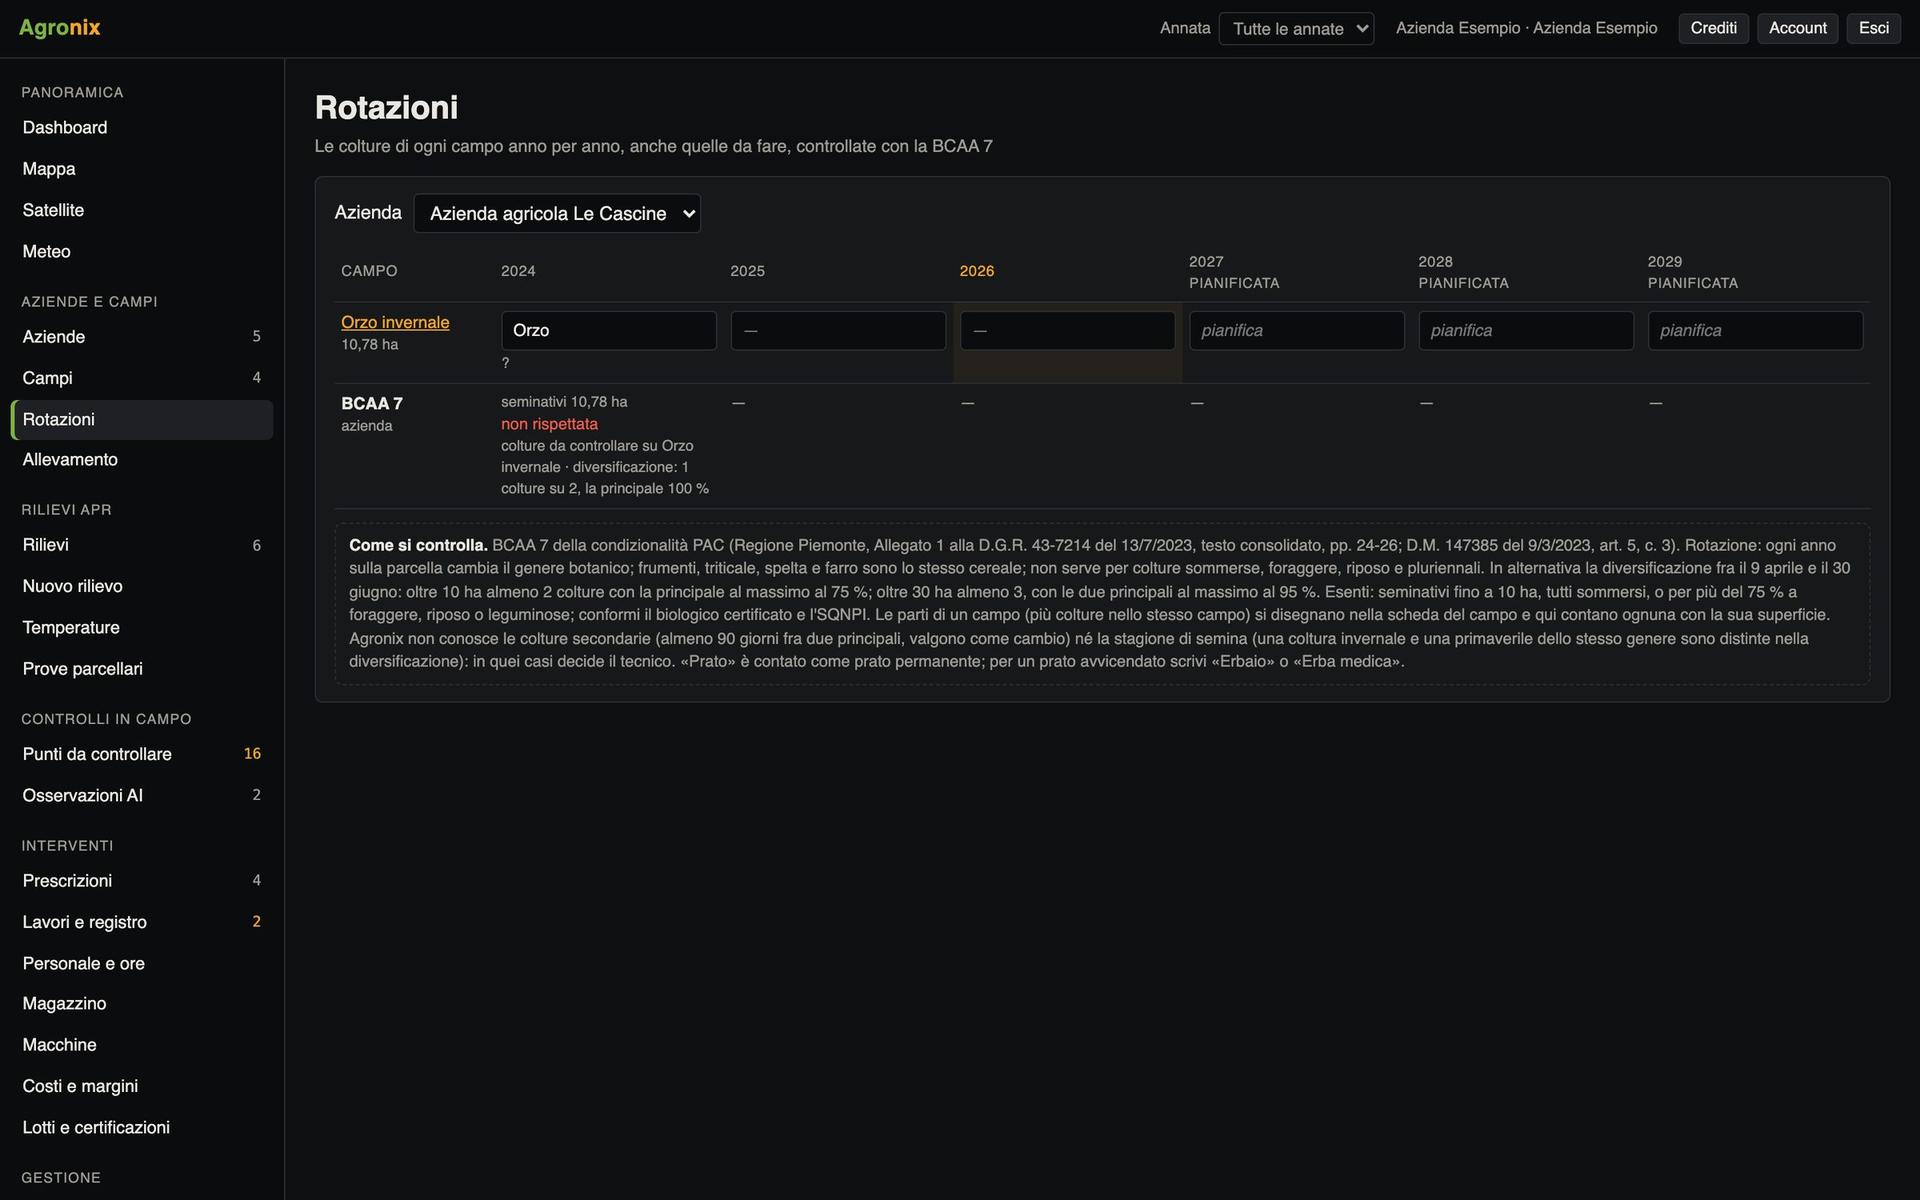
- Crop by season and rotations
- Satellite and drone on the same chart
- Field PDF report
Draw the boundary or import it
Boundaries are drawn and corrected on the map, or imported from shapefile, KML, KMZ, GeoJSON and GeoPackage in any coordinate system. Area is computed on the ellipsoid. Under the boundary Agronix finds the cadastral parcels with the hectares of each, and the Natura 2000 sites and nitrate vulnerable zones touched by the field.
- Cadastral parcels under the boundary
- Several crops in the same field, season by season
- Warning on overlapping fields
Read the soil analyses
Laboratory analyses are entered field by field with the sampling point. Agronix gives the texture class and the rating of pH, organic matter, nitrogen, C/N ratio, phosphorus, potassium, exchange capacity and lime with regional tables, and works out standard-rate nitrogen, phosphorus and potassium fertilisation for the season's crop.
- Piedmont, Lombardy and national guideline tables
- Standard rate for dozens of crops
- Document and page for every table
Screens with example data.
How it works
- 01
Create the farm
One workspace can hold several farms.
- 02
Bring the boundaries
Drawn on the map or imported from your files.
- 03
Enter the crop
Season by season, also for parts of the field.
- 04
Open the page
Surveys, satellite, zones and weather arrive on their own.
In detail
- Import
- Zipped shapefile, KML, KMZ, GeoJSON, GeoPackage, in any system.
- Export
- KML, WGS84 shapefile, GeoJSON, AB line for terminals.
- Cadastre
- Italian Revenue Agency (CC BY 4.0): municipality, sheet, parcel and hectares.
- Soil
- 2026 Piedmont and Lombardy guidelines and national guidelines.
Related features
Want to see it on your fields?
An Agronix demo with your farm's data, from survey to records.