Dashboard and map
The whole season at a glance
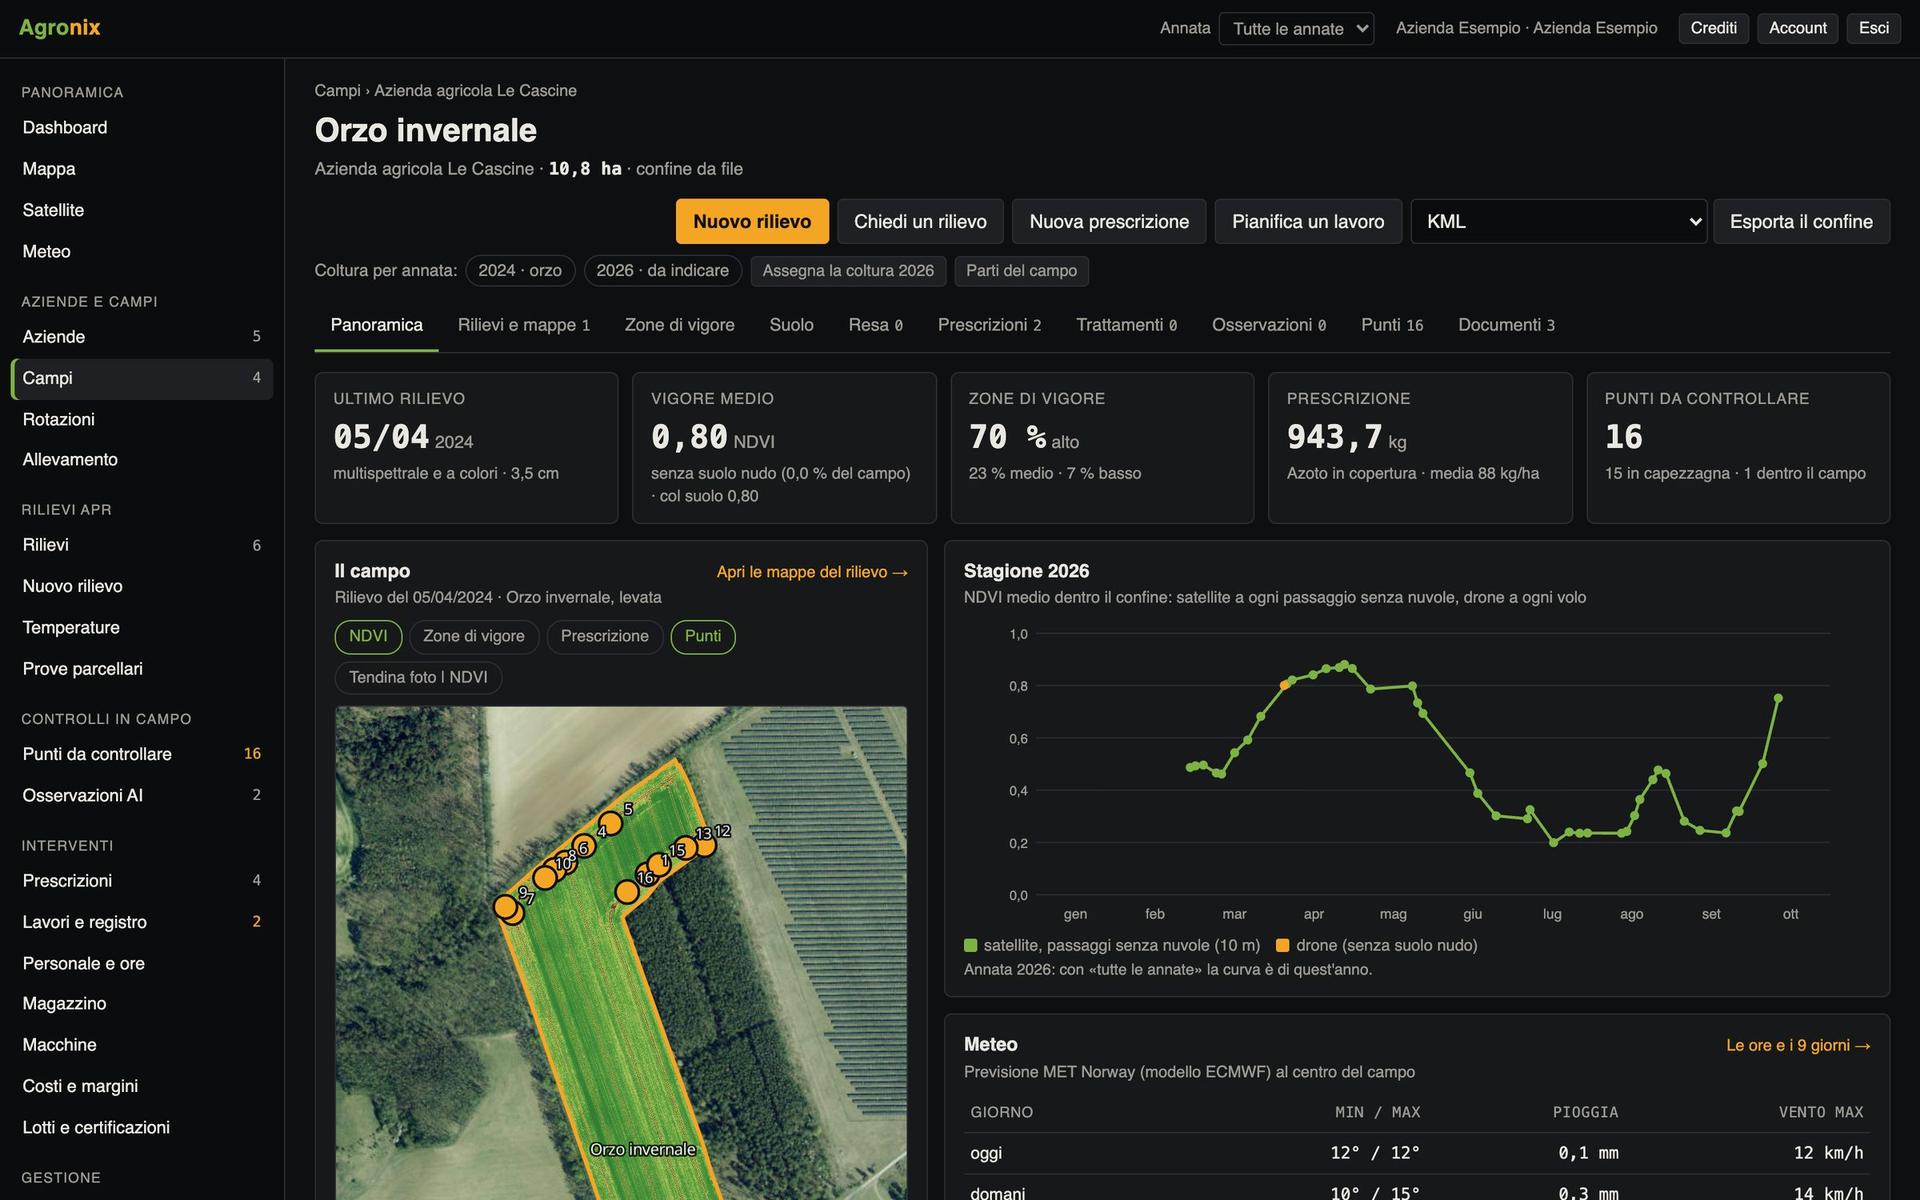
The dashboard sums up surveys, vigour, prescriptions and records; the map brings together the fields of every farm with cadastre and protected areas.
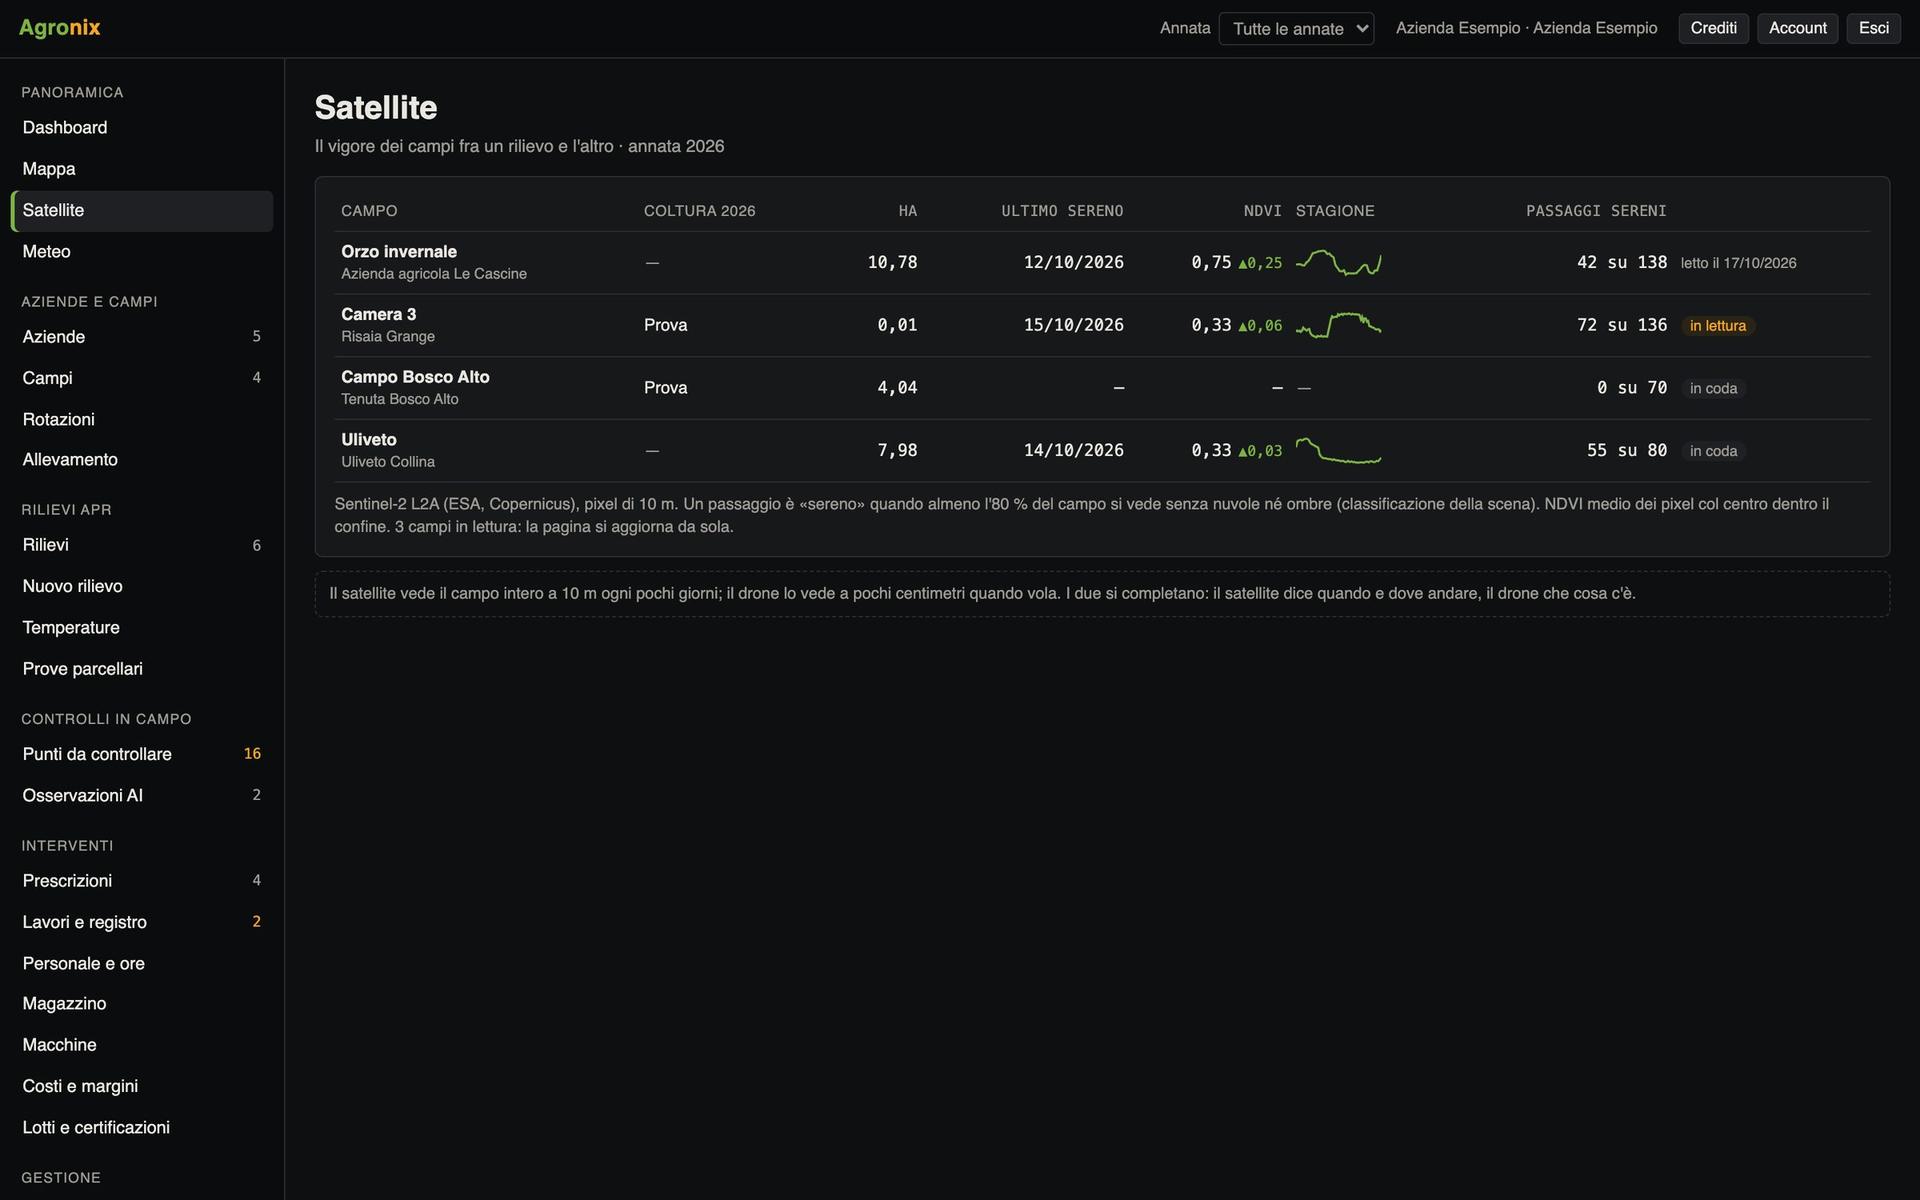
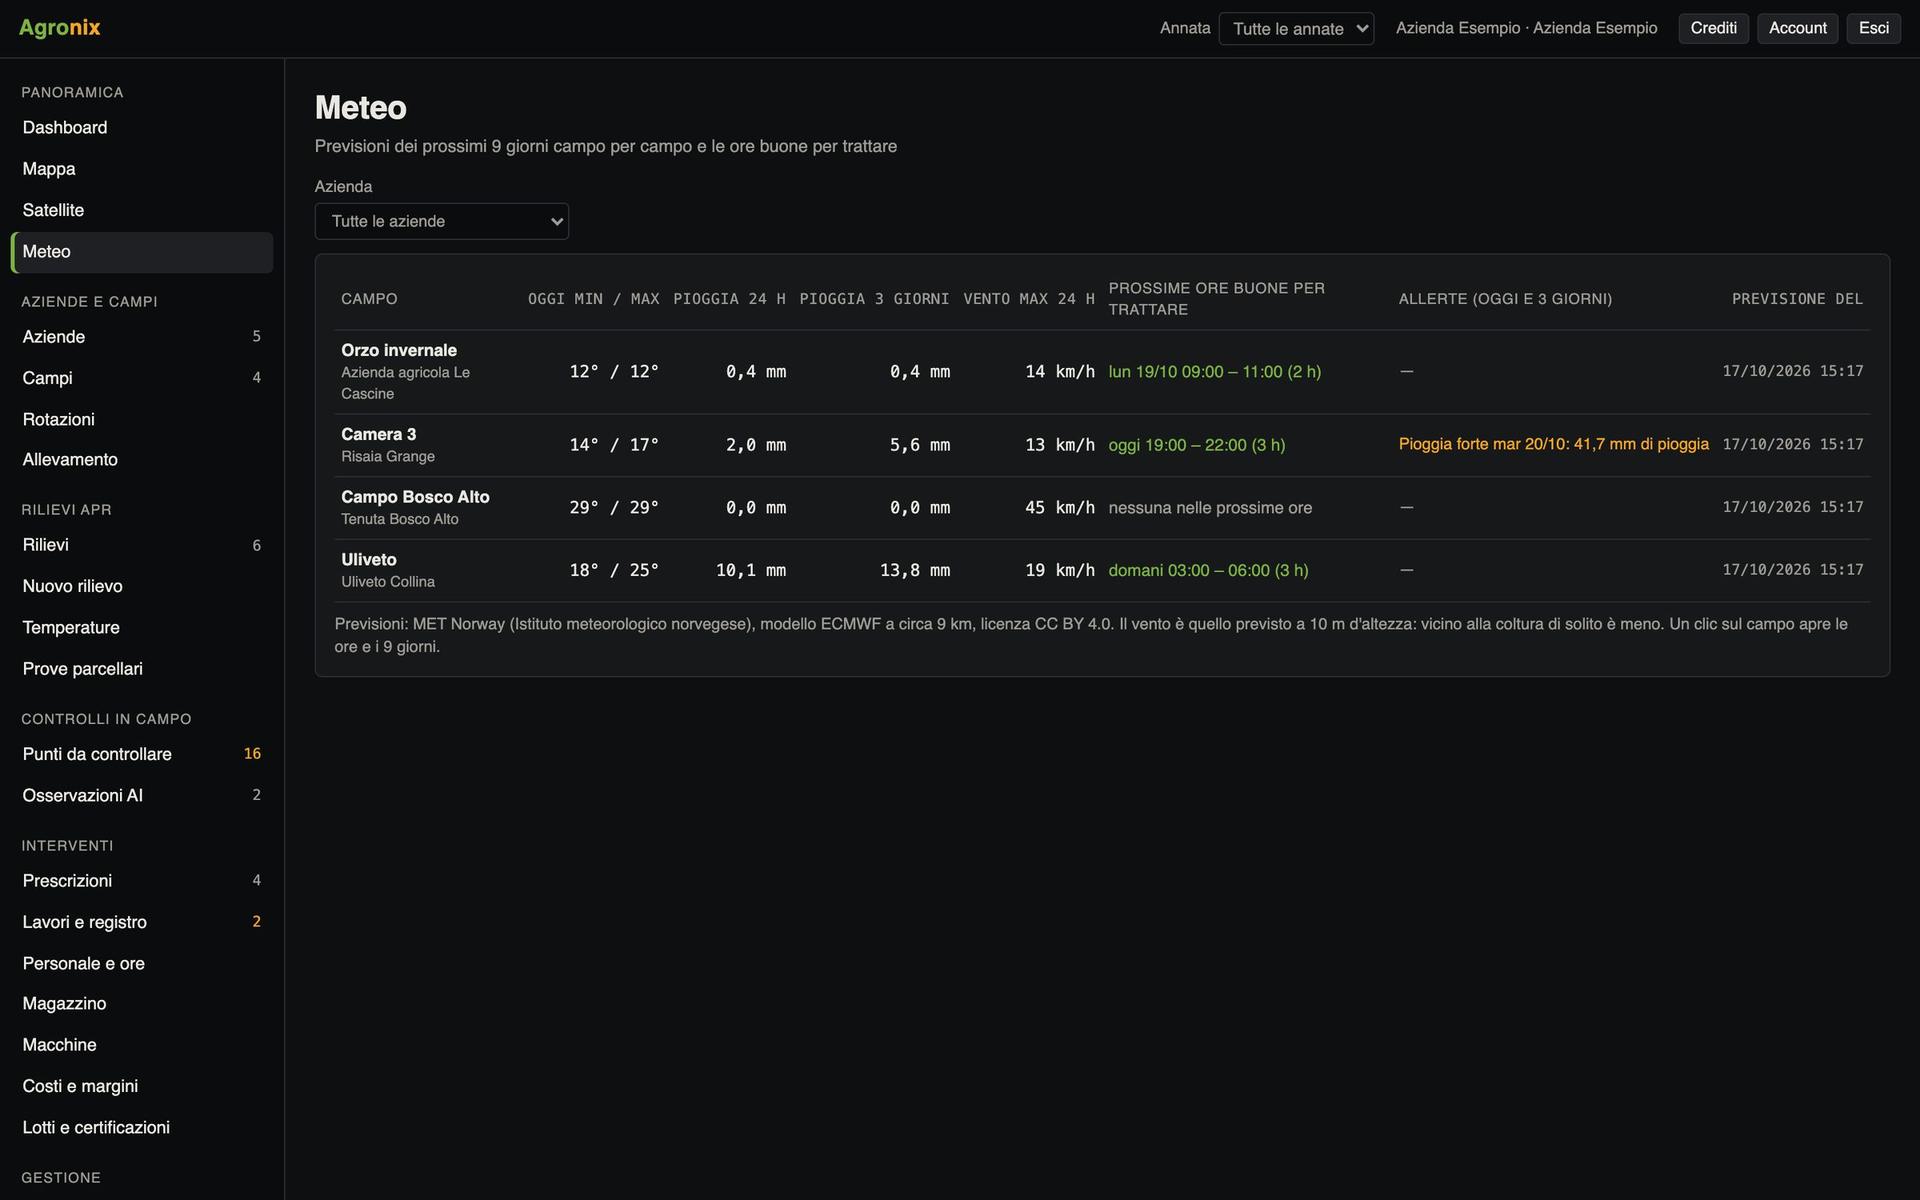
Agronix opens on the dashboard of the season chosen at the top: area managed, average vigour, surveys done, prescriptions, points to check and record entries. The same workspace can follow several farms, as an agronomist, contractor or cooperative does, and every figure leads to the page that explains it.
See the season on one screen
Charts by month, vigour classes and crop split, always drawn even when the season has just begun. The season is changed from the top bar and applies to every page: surveys, treatments and prescriptions fall in the year of their date.
- Counts in the menu for every section
- Highlighted when something needs doing
- All farms or just one
Every field on a single map
The fields of every farm coloured by crop, by vigour of the latest survey or by days since the latest survey, over high-resolution aerial imagery. On top you can switch on points to check, cadastral parcels and Natura 2000 sites; a click on the map gives municipality, sheet and parcel.
- Italian Revenue Agency cadastre layer
- Natura 2000 sites from the European Environment Agency
- Ruler and multi-field selection
Screens with example data.
How it works
- 01
Open Agronix
From the browser on computer, tablet or phone, with nothing to install.
- 02
Pick the season
From the top bar: every page shows that year.
- 03
Read the figures
The dashboard says what changed and what is left to do.
- 04
Open the field
A click on the map or the list opens the field page.
In detail
- Season
- Calendar year of the date of each survey, treatment or prescription.
- Field colours
- Crop, vigour of the latest survey, days since the latest survey.
- Layers
- Points to check, cadastral parcels, Natura 2000 sites.
- Public sources
- Italian Revenue Agency cadastre (CC BY 4.0), EEA Natura 2000.
- Several farms
- One workspace follows all the farms of an agronomist or cooperative.
Want to see it on your fields?
An Agronix demo with your farm's data, from survey to records.