Nothing to install
Work from the browser, on Windows and Mac: photos are uploaded from the computer you already use.
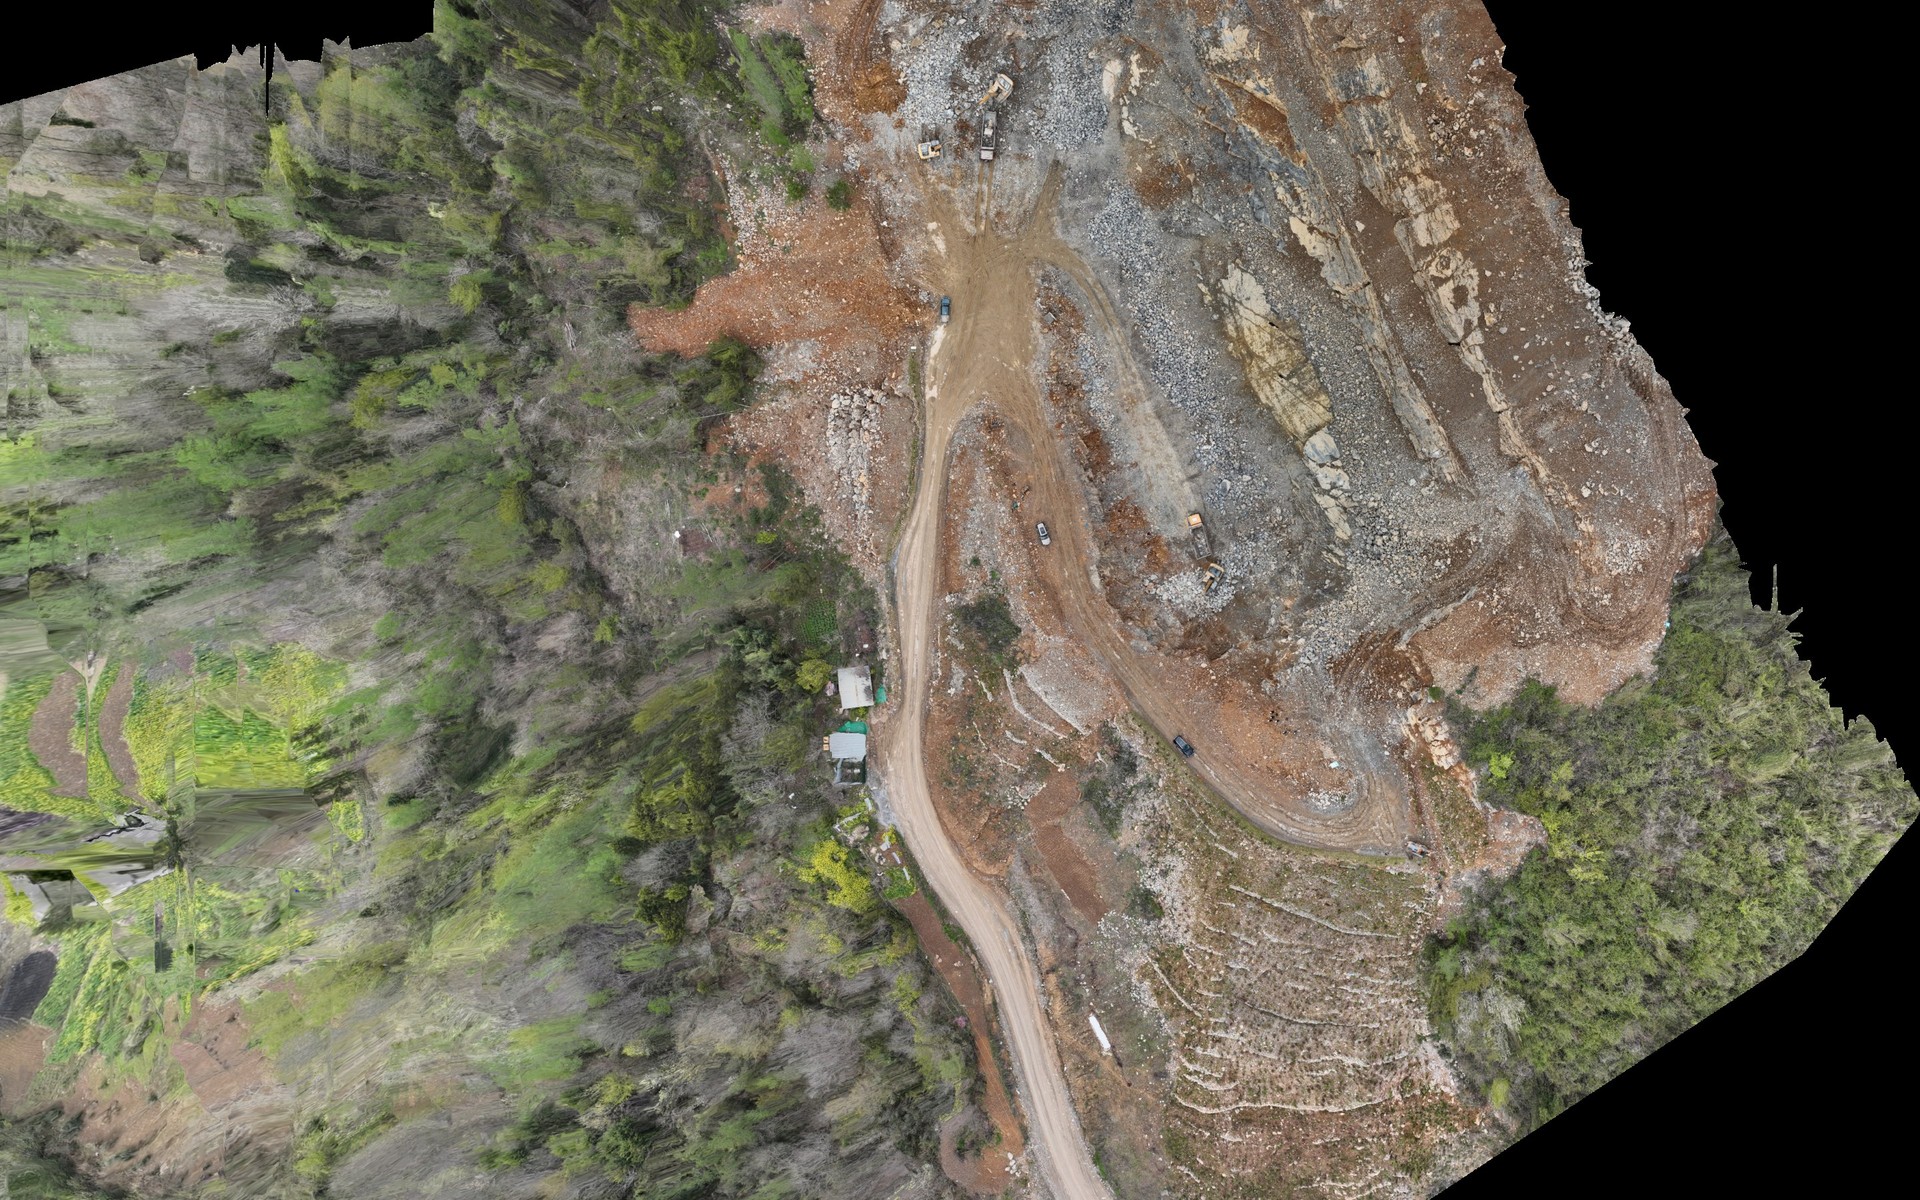
Orthophoto processed by Pixel Air with Landnix from the photos of the “Tongjiang Aerial Dataset v2.0” by Chen Huifu, Fang Yixuan and Zhang Jiasui, CC BY 4.0.
Landnix · Pixel Air proprietary software
Photogrammetry and thermography from the browser
Landnix turns drone photos into orthophotos, terrain models, point clouds, 3D models and temperature maps. It runs in the browser, on Windows and Mac, with nothing to install: photos are uploaded from the computer and processed on our servers in Europe. It checks the photos before upload, corrects thermal measurements image by image and produces the delivery report.
Choose the version
Available soon
Pricing and licences coming soon
What is included
Requirements. An up-to-date browser and an internet connection to upload the photos. Processing runs on our servers in Europe.
Landnix
Compared with other photogrammetry software, Landnix corrects the distance in thermal measurements photo by photo and documents accuracy in the delivery report, from the browser and with nothing to install.
Work from the browser, on Windows and Mac: photos are uploaded from the computer you already use.
Processing runs on our servers in Europe: no powerful computer is needed and your own stays free.
Distance to the subject is taken from each photo's altitude instead of a fixed value: on our images the difference was about 2.4 °C.
Thermal maps with temperatures in degrees Celsius, ready to deliver.
Photos without a position, thermal shots mixed with visible ones and RTK not always in FIX show up before upload.
PPK, control and check points and an automatic delivery report.
Temperature calculation requires the distance to the subject. Without this value, standard tools apply a default of 5 metres, while a roof is normally shot from several tens of metres. Values measured on our images:
The discrepancy is about 2.4 °C, always in the same direction, and in a thermal survey it can change how an anomaly is classified. Landnix reads the altitude recorded in each image's metadata and uses it as the distance, frame by frame.
| Distance set | Mean temperature |
|---|---|
| 5 mdefault distance | 13,78 °C |
| 25 m | 13,14 °C |
| 100 m | 11,39 °C |
| 300 msaturated, same as 100 m | 11,39 °C |
Distance is derived from each frame's altitude rather than from a single fixed value. Emissivity and the parameters used are recorded in the results.
Photos without a position, thermal shots mixed with visible ones and RTK not always in FIX are flagged before uploading and starting processing that can take hours.
Survey parameters, conditions and limits in a document to attach to the technical report, with the accuracy measured on the control points.
Work from the browser, on Windows and Mac. Computing runs on our servers in Europe: no powerful computer is needed and your own stays free.
Landnix
Georeferenced orthophotos, terrain and surface models, point grids and TINs ready for design software.
Terrain models and point clouds of the current state, to compare over time in calculation software.
Temperature in degrees Celsius for every image and a thermal map of the whole flight, with the distance corrected image by image.
Textured 3D models from oblique photos, in OBJ and GLB, for modelling and presentation software.
No software to install and no powerful computer needed: an up-to-date browser and a connection to upload the photos are enough.
Check against ground-surveyed control points, recorded in the delivery report.
Landnix