Vigour zones and yield
Split the field into zones
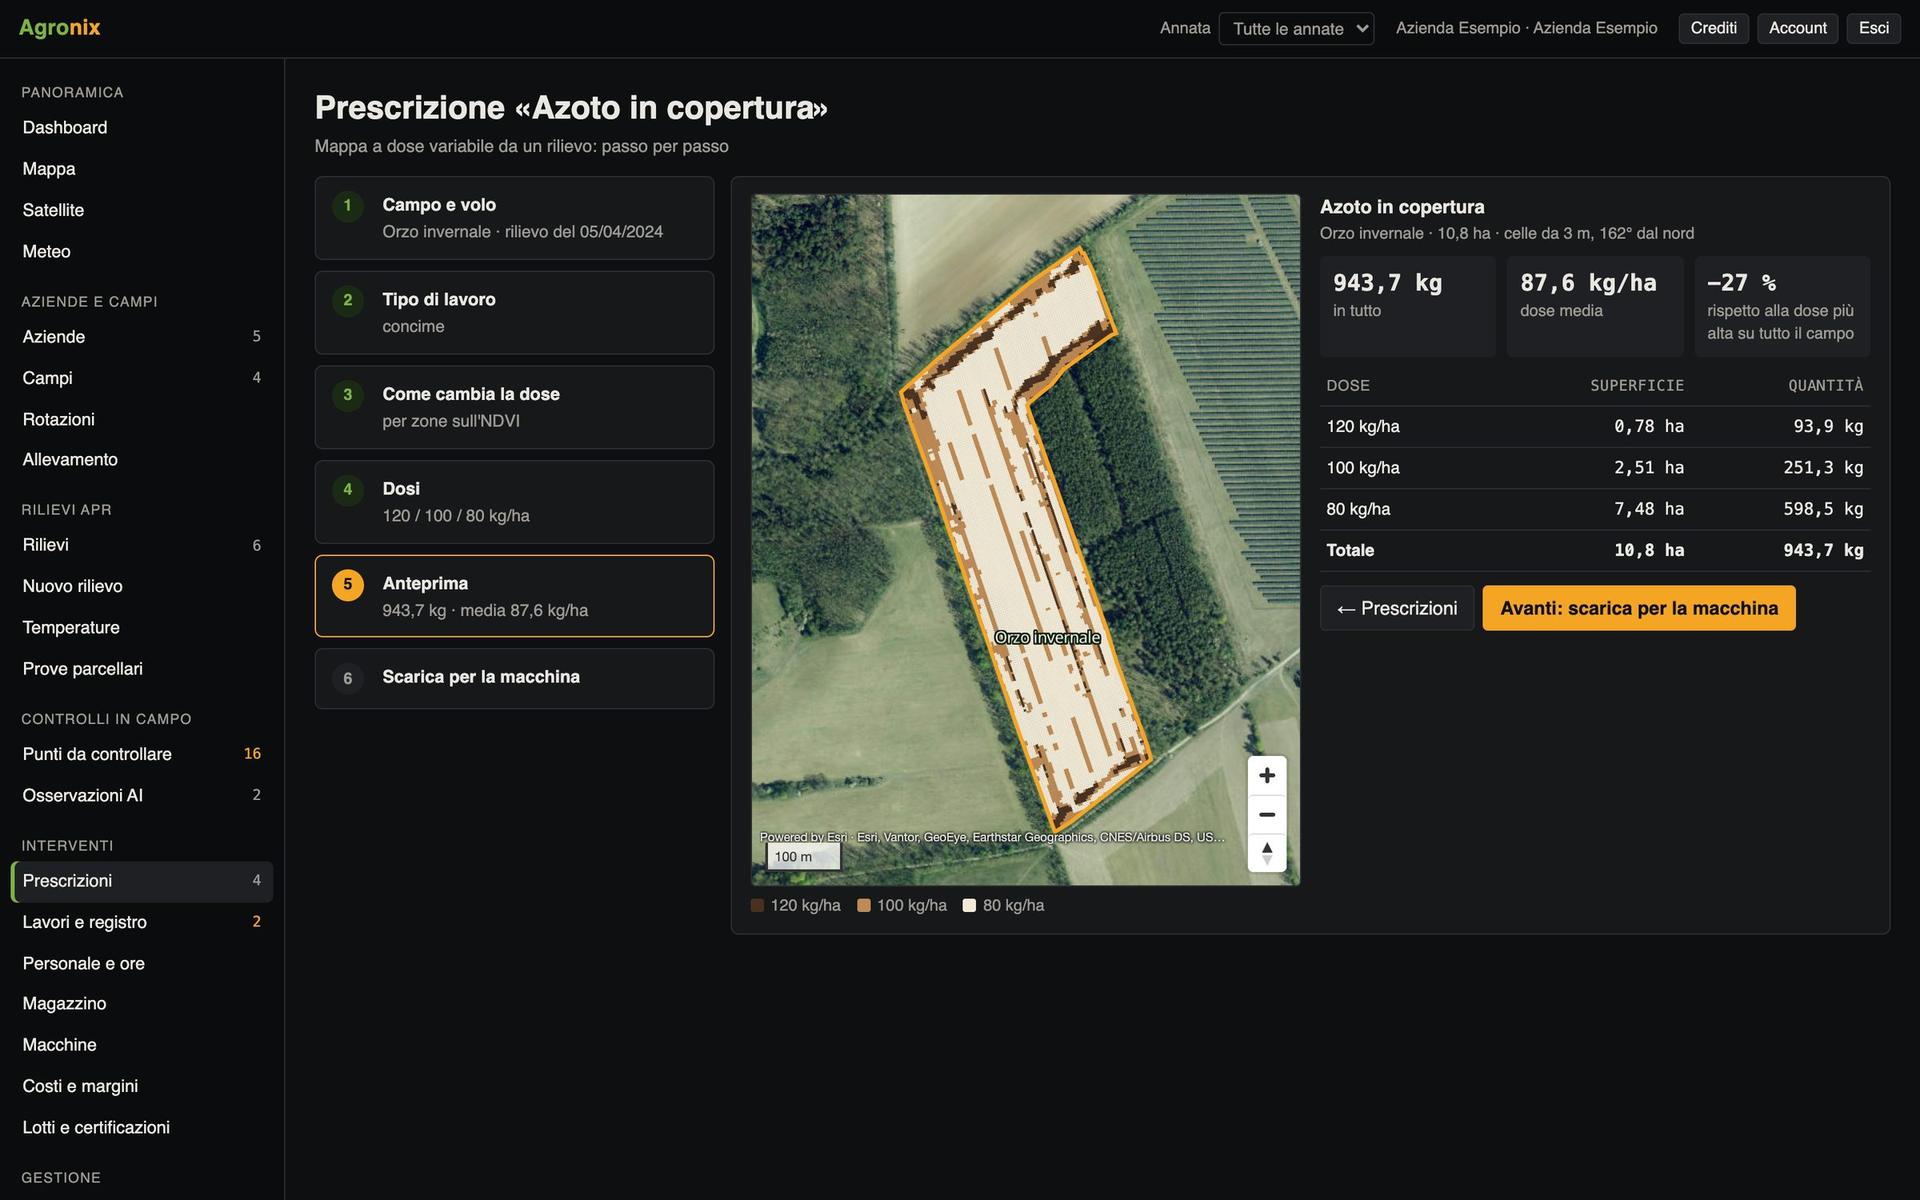
Vigour zones are the basis of variable rate: from a single survey, from past satellite seasons or from combine yield maps.
A field is not the same everywhere: some parts always yield more, some always less and some change from year to year. Agronix splits the field into zones in three ways: from a survey, when a decision is needed for this season; from past satellite seasons and yield maps, when you need to know where the field is stable. The prescription is built from the zones.
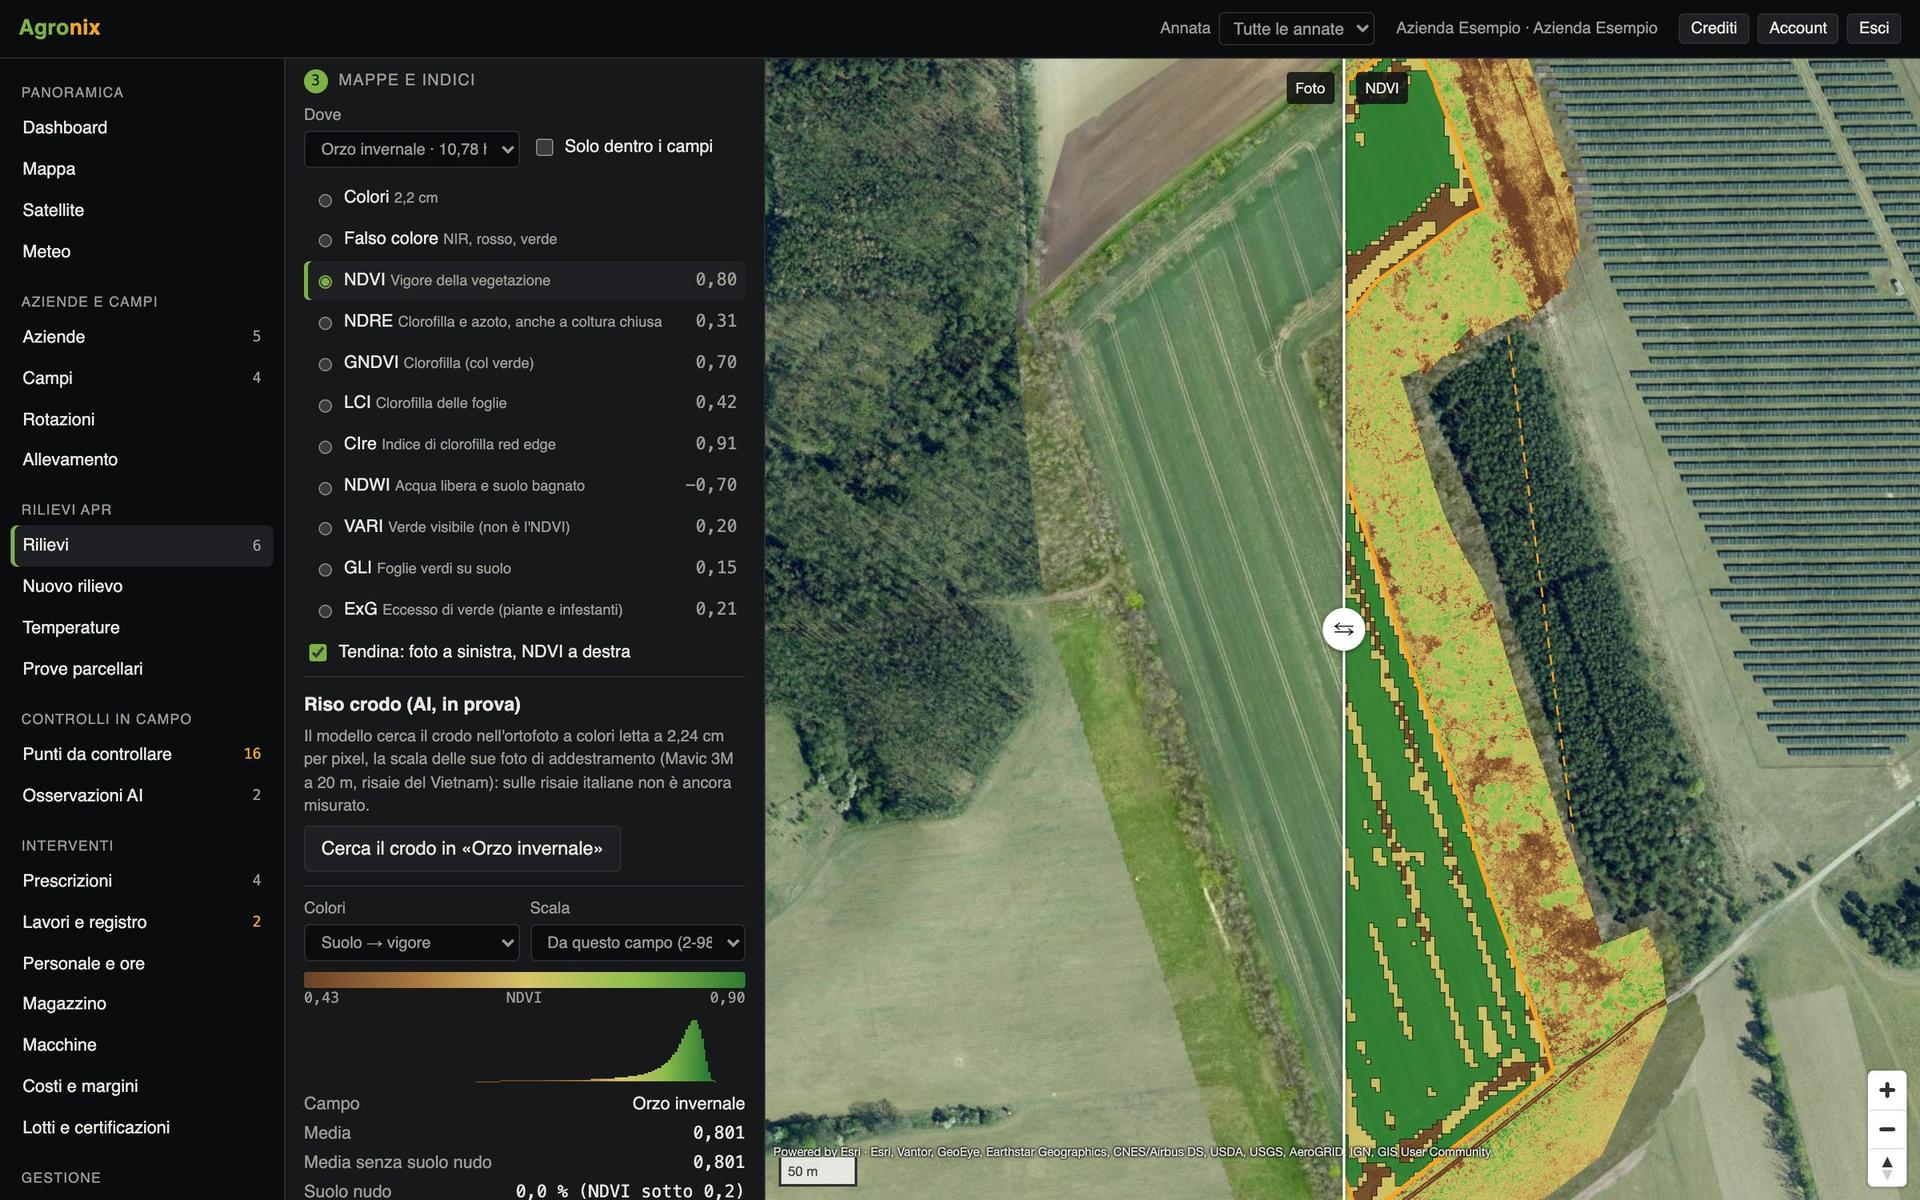
Zones from an index, in a few clicks
Choose the index and the cell width, usually the machine's working width, then the method: equal intervals, quantiles, natural breaks, above and below the mean or hand-written thresholds. Isolated cells are cleaned up and the table gives hectares and mean of every zone.
- Five classification methods
- Cells as wide as the machine
- KML, shapefile and GeoJSON
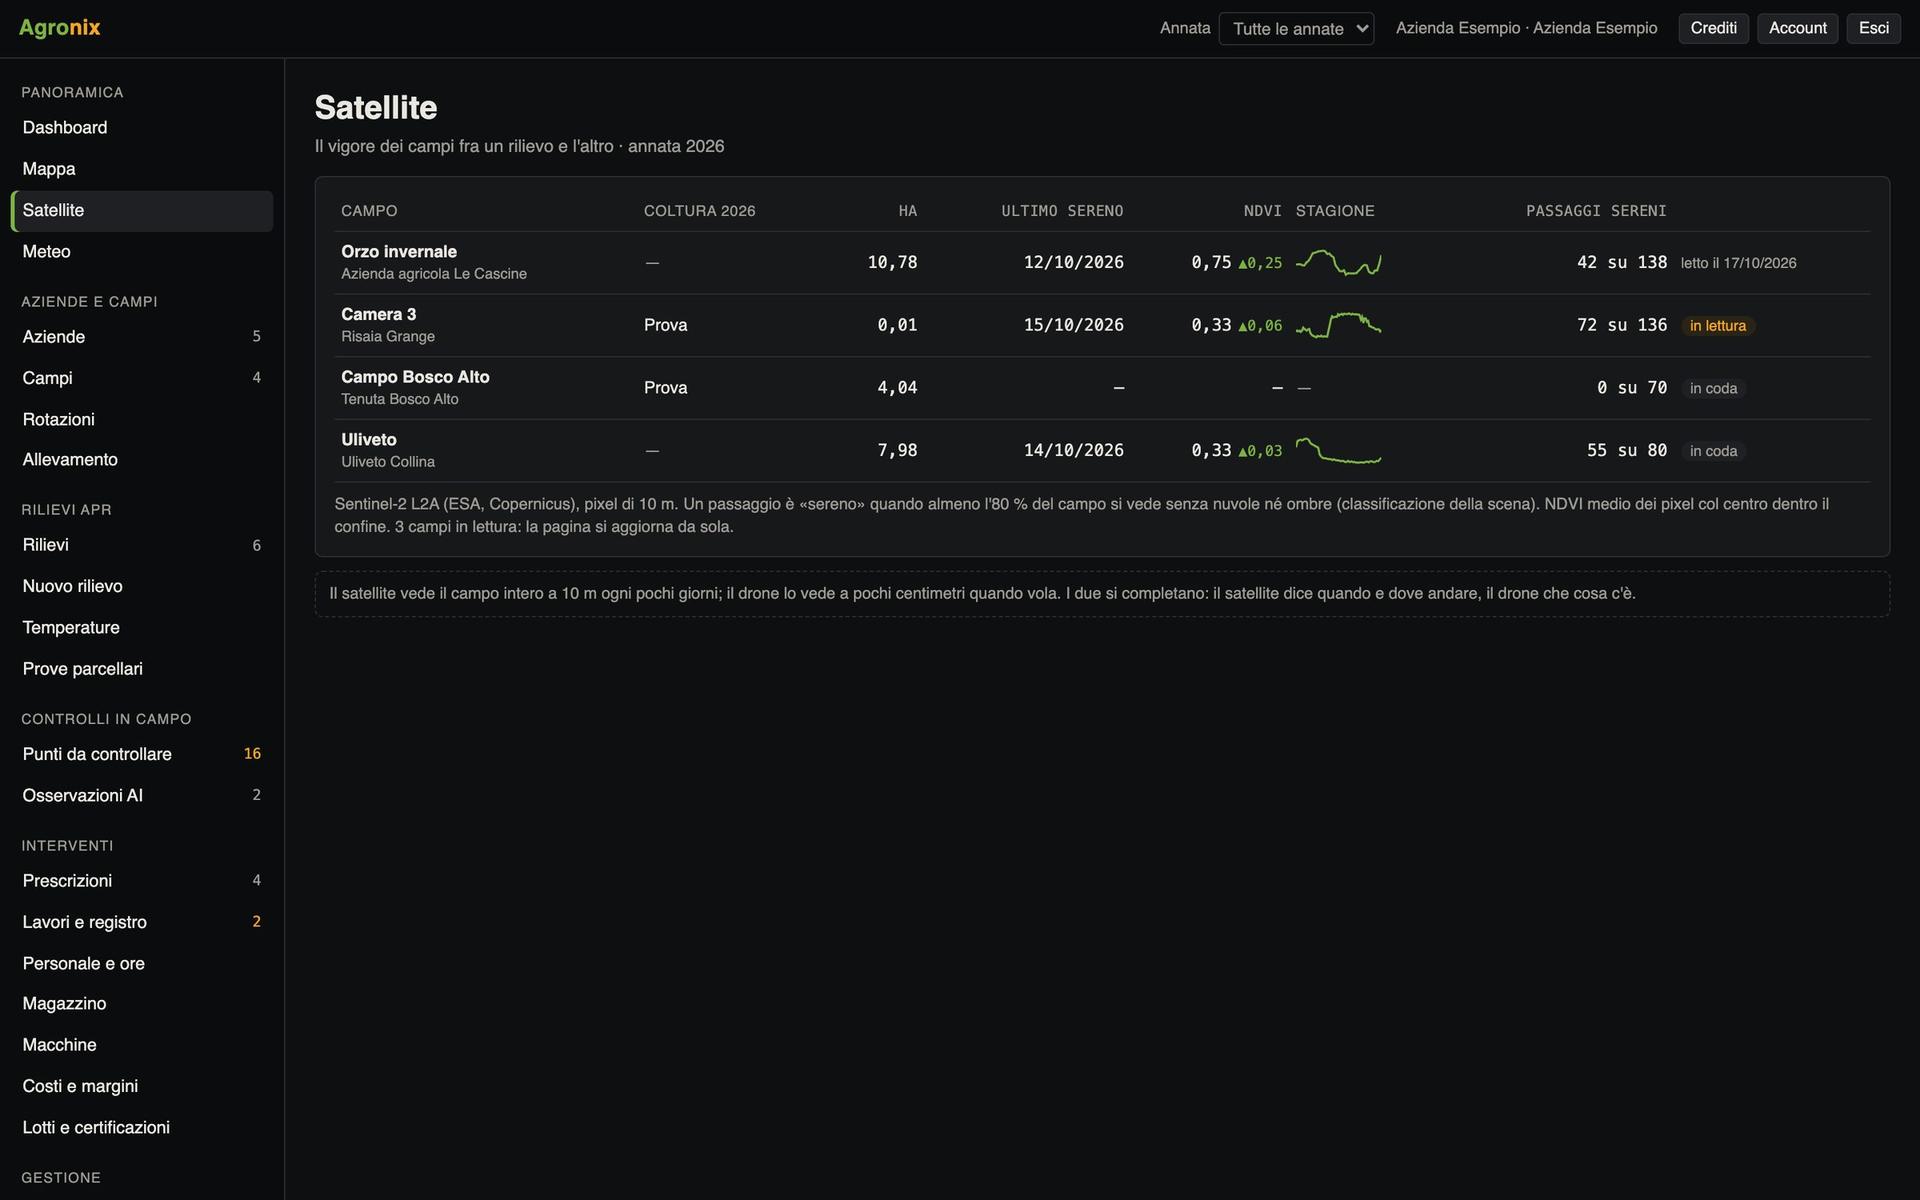
Where the field always yields more or less
Agronix reads the satellite of past seasons, from 2017, at each season's peak green, and yield maps where available. Three zones come out: high and stable, low and stable, unstable. The method is the one published in agronomic literature and is written on the page; rates for fertiliser and seeding are set on the zones.
- Seasons from 2017, one by one
- High, low and unstable, with hectares
- Rate per zone and machine files
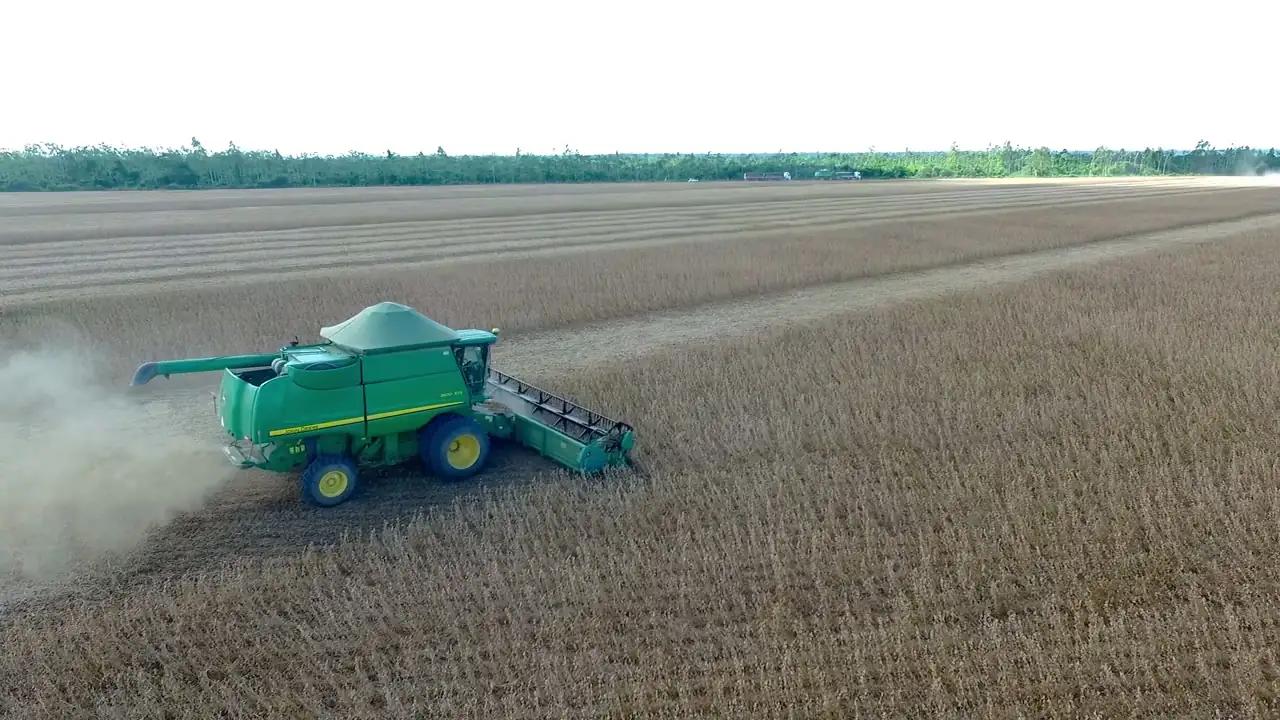
Clean the combine data
Yield data is loaded from combine files: shapefile, GeoJSON or ISOBUS TimeLog. Agronix removes faulty points with published filters (outside the field, header raised, start and end of pass, speed, overlaps, out-of-range values), corrects yield to standard moisture and compares it with the harvests in the records.
- Map in t/ha on the field page
- Discarded points with the reason
- Yield at standard moisture
Screens with example data.
How it works
- 01
Choose the basis
A survey, satellite seasons or yield maps.
- 02
Choose the classes
Method and cell width.
- 03
Check the zones
Hectares, mean and map of every zone.
- 04
Set the rate
One rate per zone, then the machine file.
In detail
- Methods
- Equal intervals, quantiles, natural breaks, mean, manual thresholds.
- Stable zones
- Sentinel-2 from 2017, March to September (winter cereals until 30 June).
- Yield files
- Point shapefile, GeoJSON, ISOBUS TASKDATA with TimeLog.
- Exports
- KML, shapefile, GeoJSON and machine prescriptions.
Related features
Want to see it on your fields?
An Agronix demo with your farm's data, from survey to records.