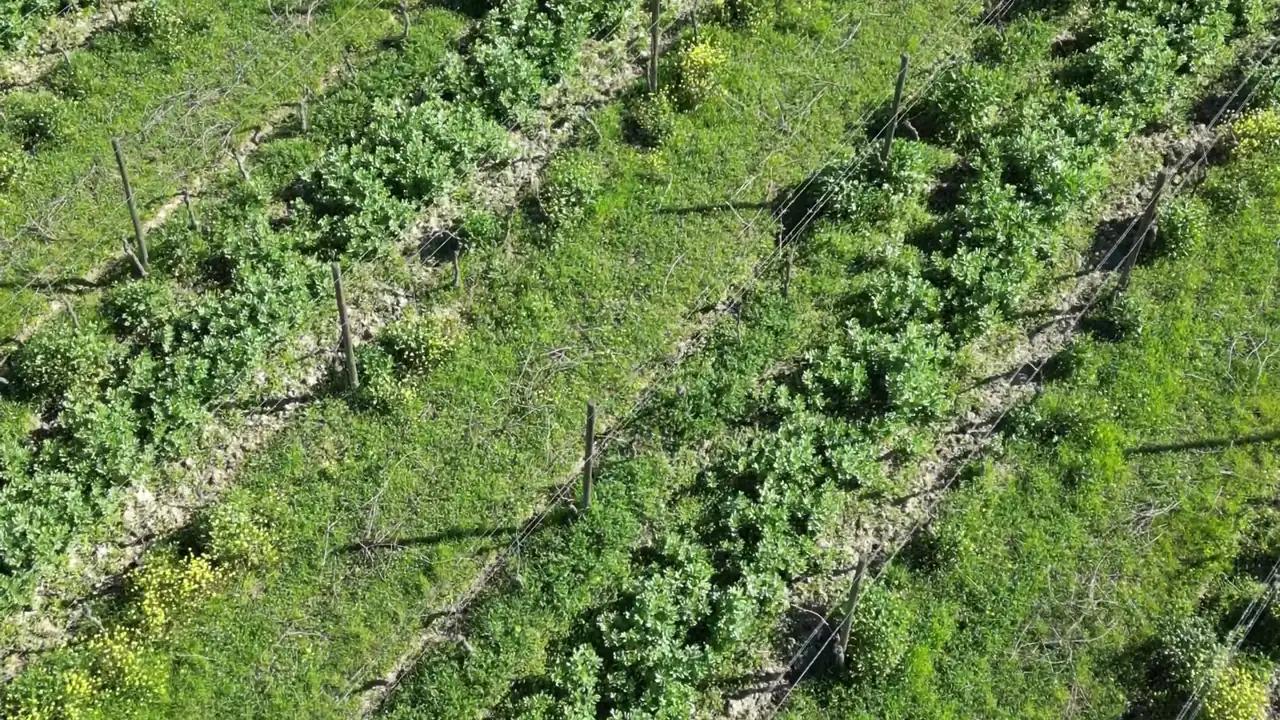
Vigour maps and indices
Nine indices to read the field
From the same flight NDVI for vigour, NDRE for chlorophyll and nitrogen, NDWI for water and six more indices, with statistics for every field and comparison between flights.
Each index answers a different question. NDVI shows where the crop is most vigorous; NDRE sees chlorophyll and nitrogen even when the canopy is closed and NDVI no longer separates; NDWI finds open water and wet soil. From colour photos, without a multispectral camera, the visible-light indices are computed. Agronix computes them all from the same flight and clips them field by field.
Compare photo and index on the same spot
The slider puts the photo on the left and the index on the right, on the same pixel: you see at once whether a red patch is a gap, a wheel track or a flooded area. It works on the survey page and on the field page.
- Photo and index on the same pixel
- Colour scale fitted to the chosen field
- Legend with the meaning of the index
True averages, without the soil between rows
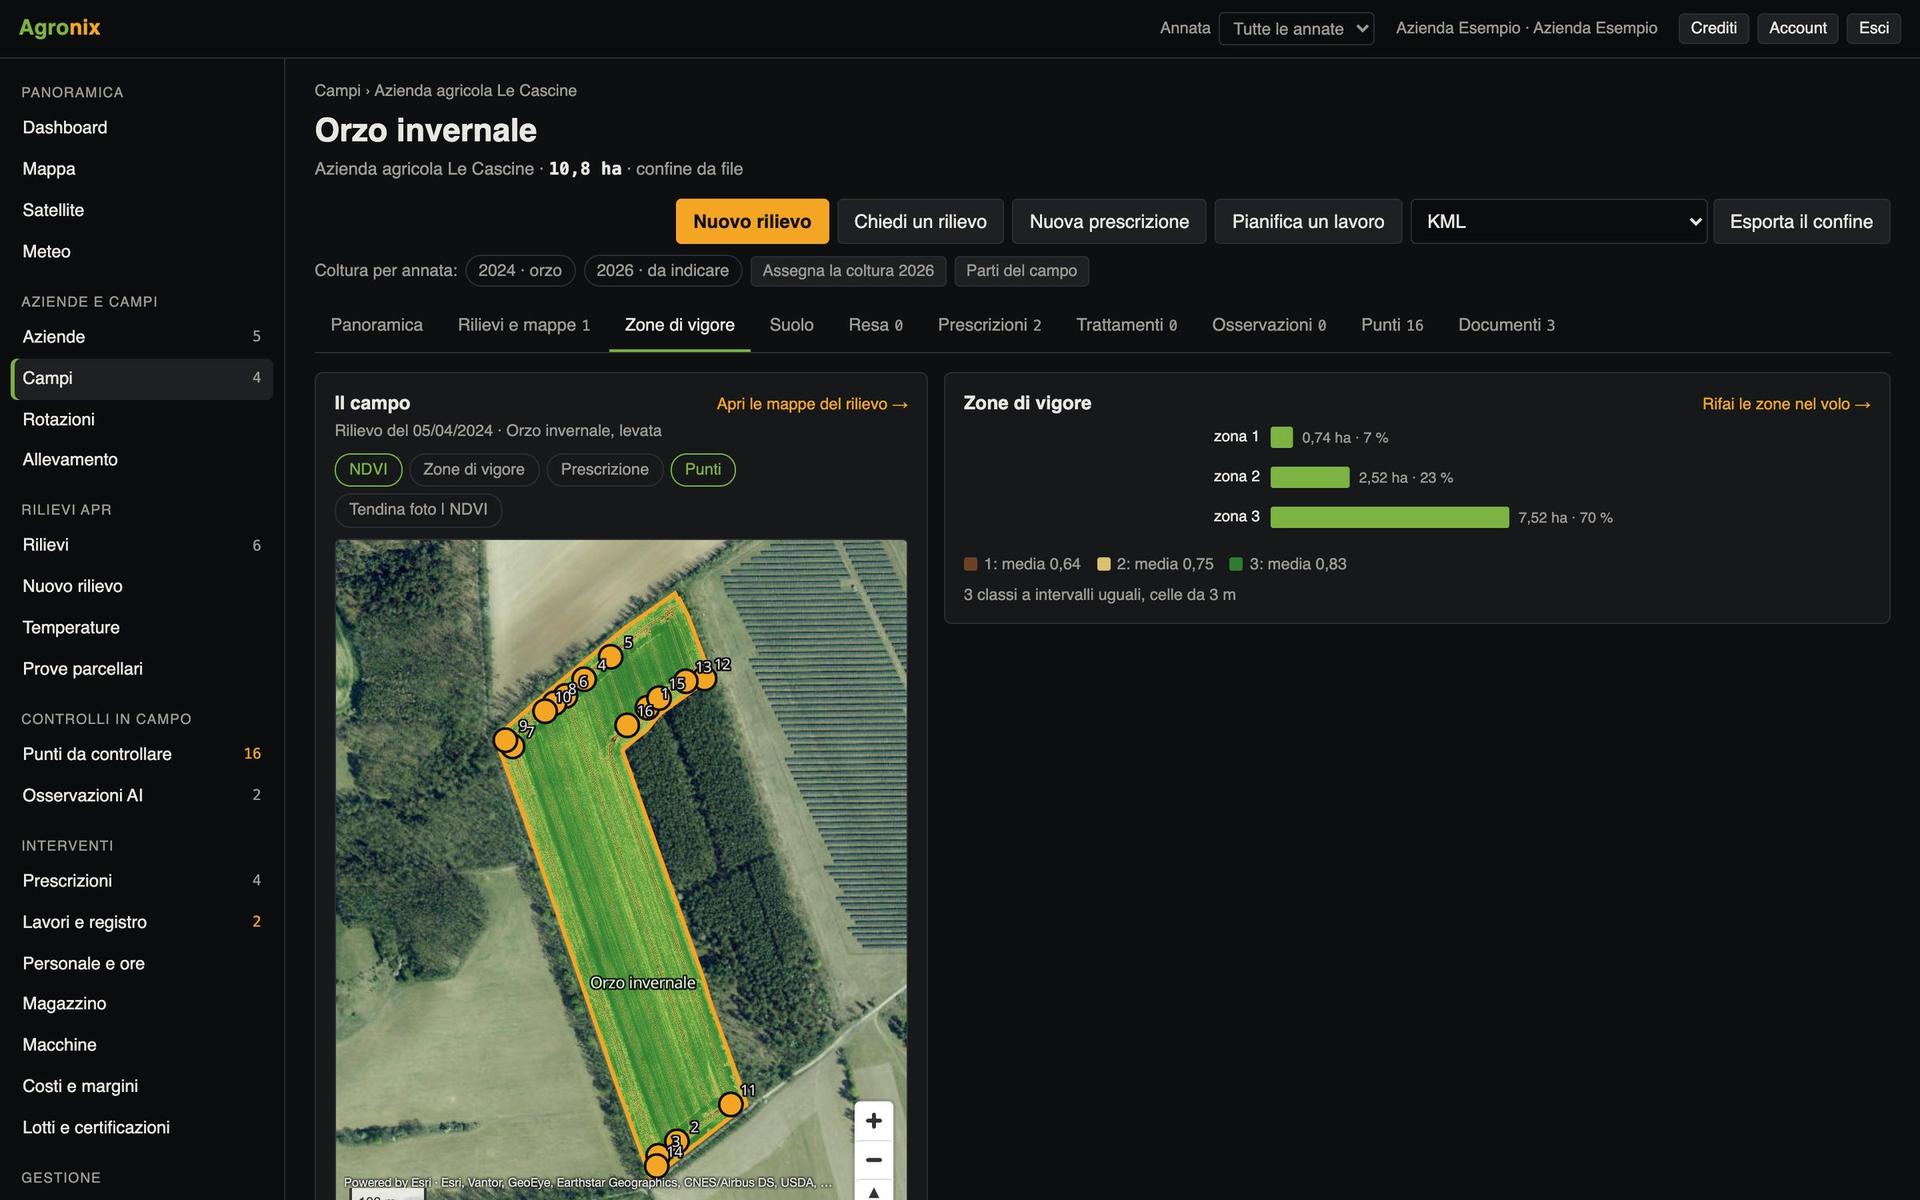
For every field and every index: mean, deviation, histogram, at full resolution. Bare soil is recognised and kept out of the averages, so a vineyard or young maize do not look weaker than they are. Statistics are redone automatically when the boundary changes or a new map arrives.
- Bare soil share per field
- Histogram, mean and deviation
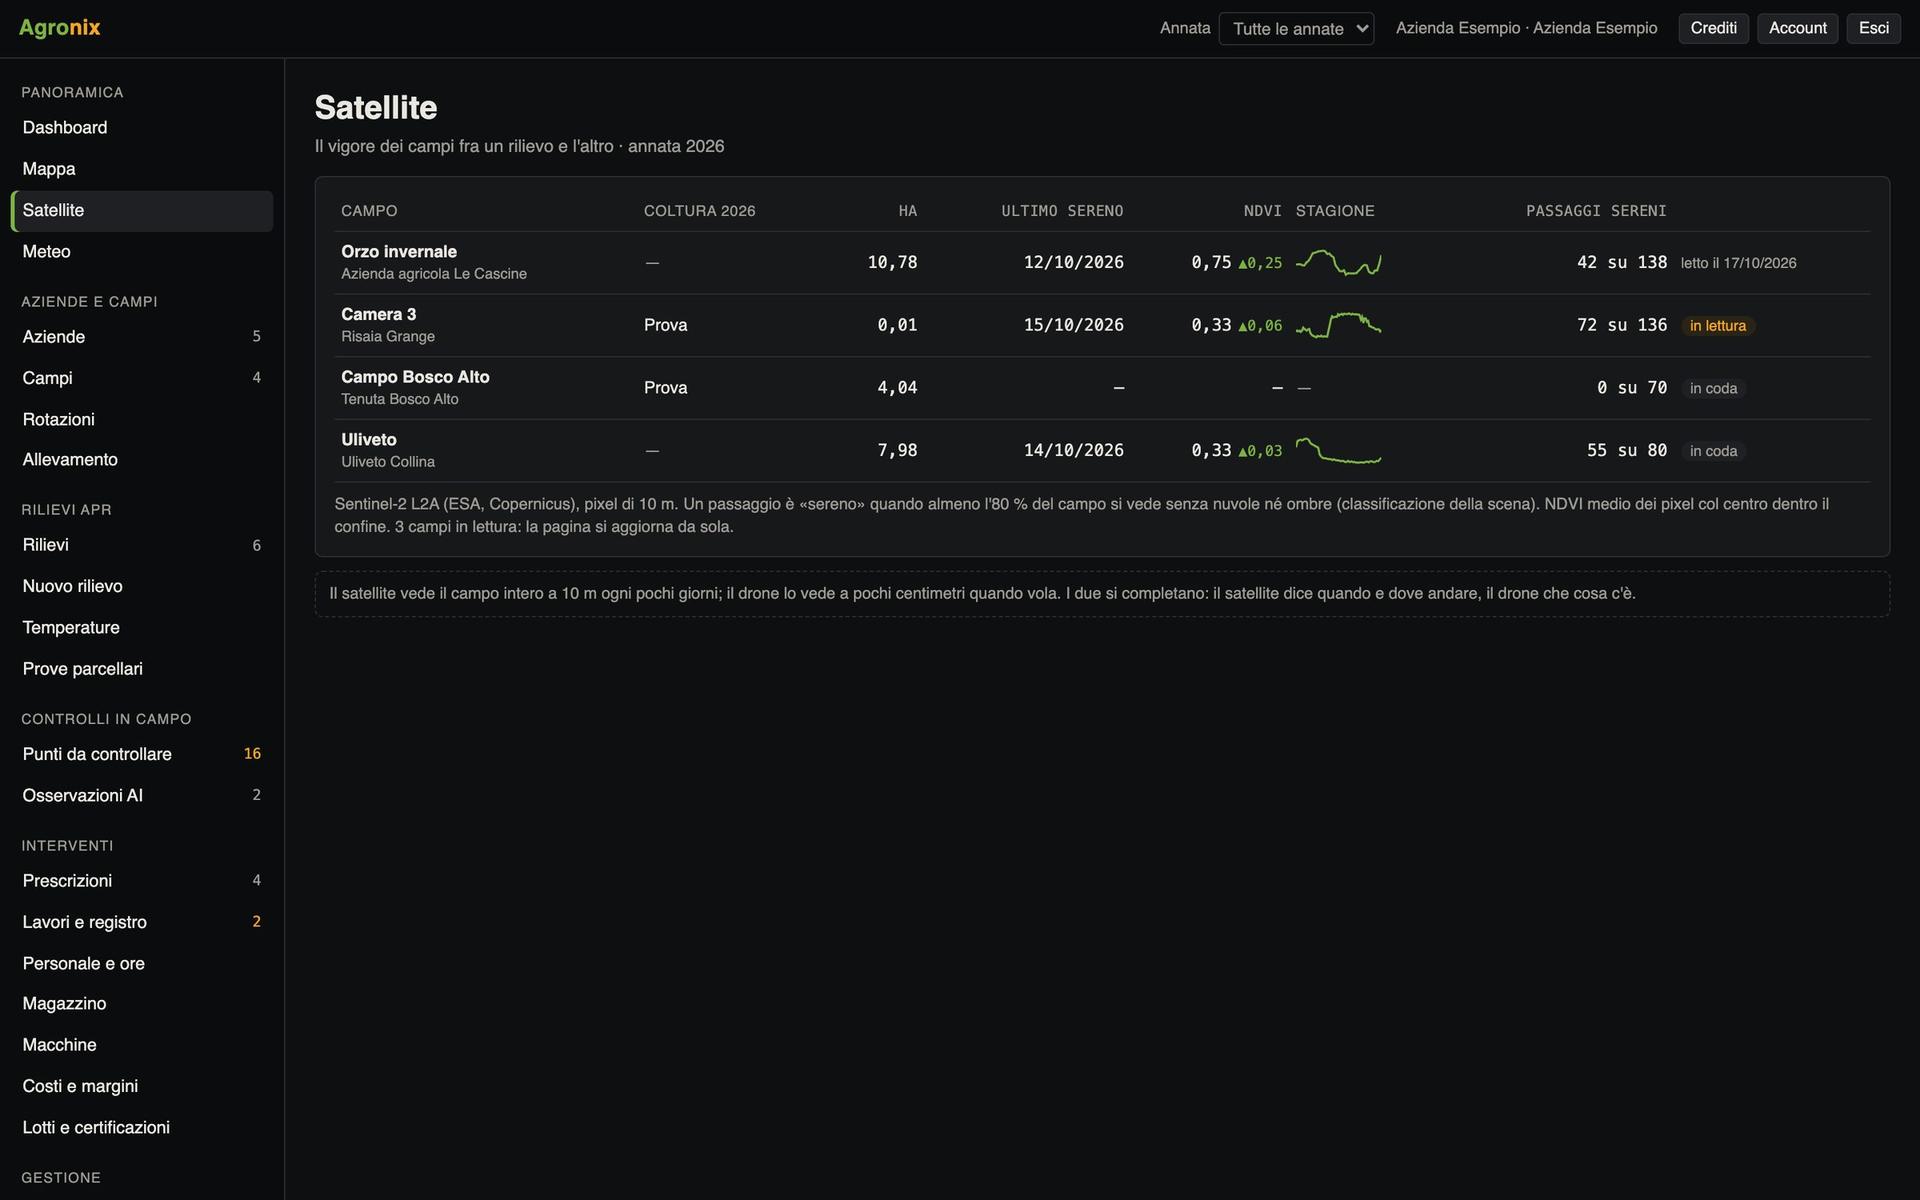
- Trend flight by flight
See what changed between two flights
Two surveys of the same field are put on the same grid and the map shows where the index went up, down or stayed the same. The field PDF report gathers colour map, index with statistics and histogram, all indices, zones, trend and method notes, with north arrow, scale and boundary.
- Difference map as GeoTIFF
- Field PDF report
- GeoTIFF of every index clipped to the boundary
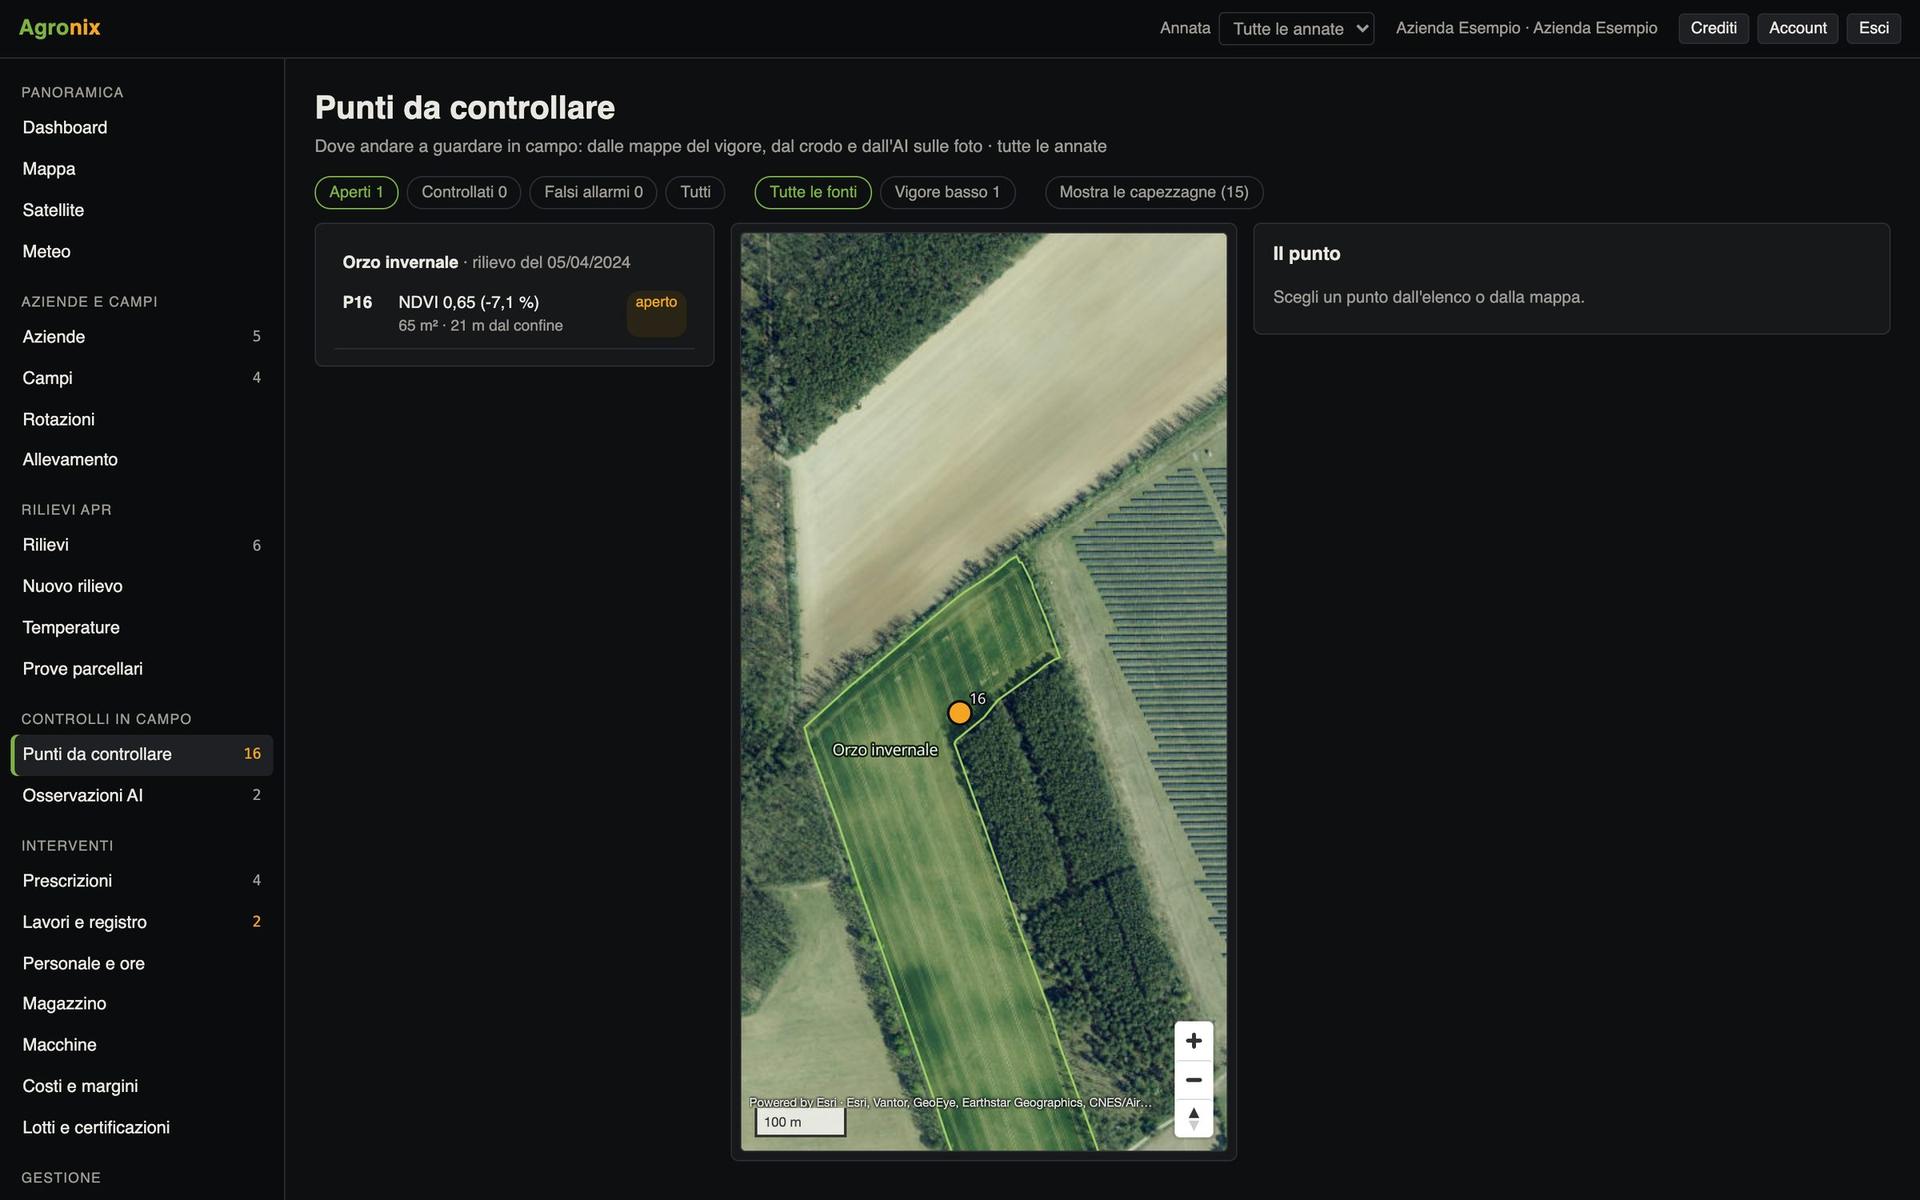
Screens with example data.
How it works
- 01
Open the survey
The map is already framed on the field.
- 02
Choose the index
Each index says in one line what it is for.
- 03
Drag the slider
Photo and index on the same spot.
- 04
Download or compare
GeoTIFF, PDF report or comparison with another flight.
In detail
- From multispectral
- NDVI, NDRE, GNDVI, LCI, CIre, NDWI.
- From colour photos
- VARI, GLI, ExG: visible-green indices, not a substitute for NDVI.
- Bare soil
- NDVI below 0.2 or, from colour photos, GLI below 0.
- Formats
- GeoTIFF, PDF, CSV of statistics.
Want to see it on your fields?
An Agronix demo with your farm's data, from survey to records.