Skip to content
All sectors

Agriculture

The field read zone by zone: gaps, waterlogging, lodging and damage measured on the orthophoto, not estimated from the headland.

A plot is never uniform: levelling, water and emergence all vary. From the road you see the edge, and the edge is the part that looks best. What happens in the middle — a twenty-metre gap, waterlogging that sits for two weeks, lodging after a storm — is only visible from above, and only measurable if the flight is georeferenced. Rice paddies add water: levelling of the basins, standing water and drying-out read far better straight down than from the bund.

Figures for this sector

1 cm/px
ground detail: a single plant is distinguishable
0.05 °C
the smallest temperature difference the sensor separates
48 h
from flight to files, report included

What we do

Orthophoto of the plot

Grid flight with computed overlap — never below 60% side and 65% forward — returned as a single georeferenced image: every point has coordinates, so every area is measured on the file.

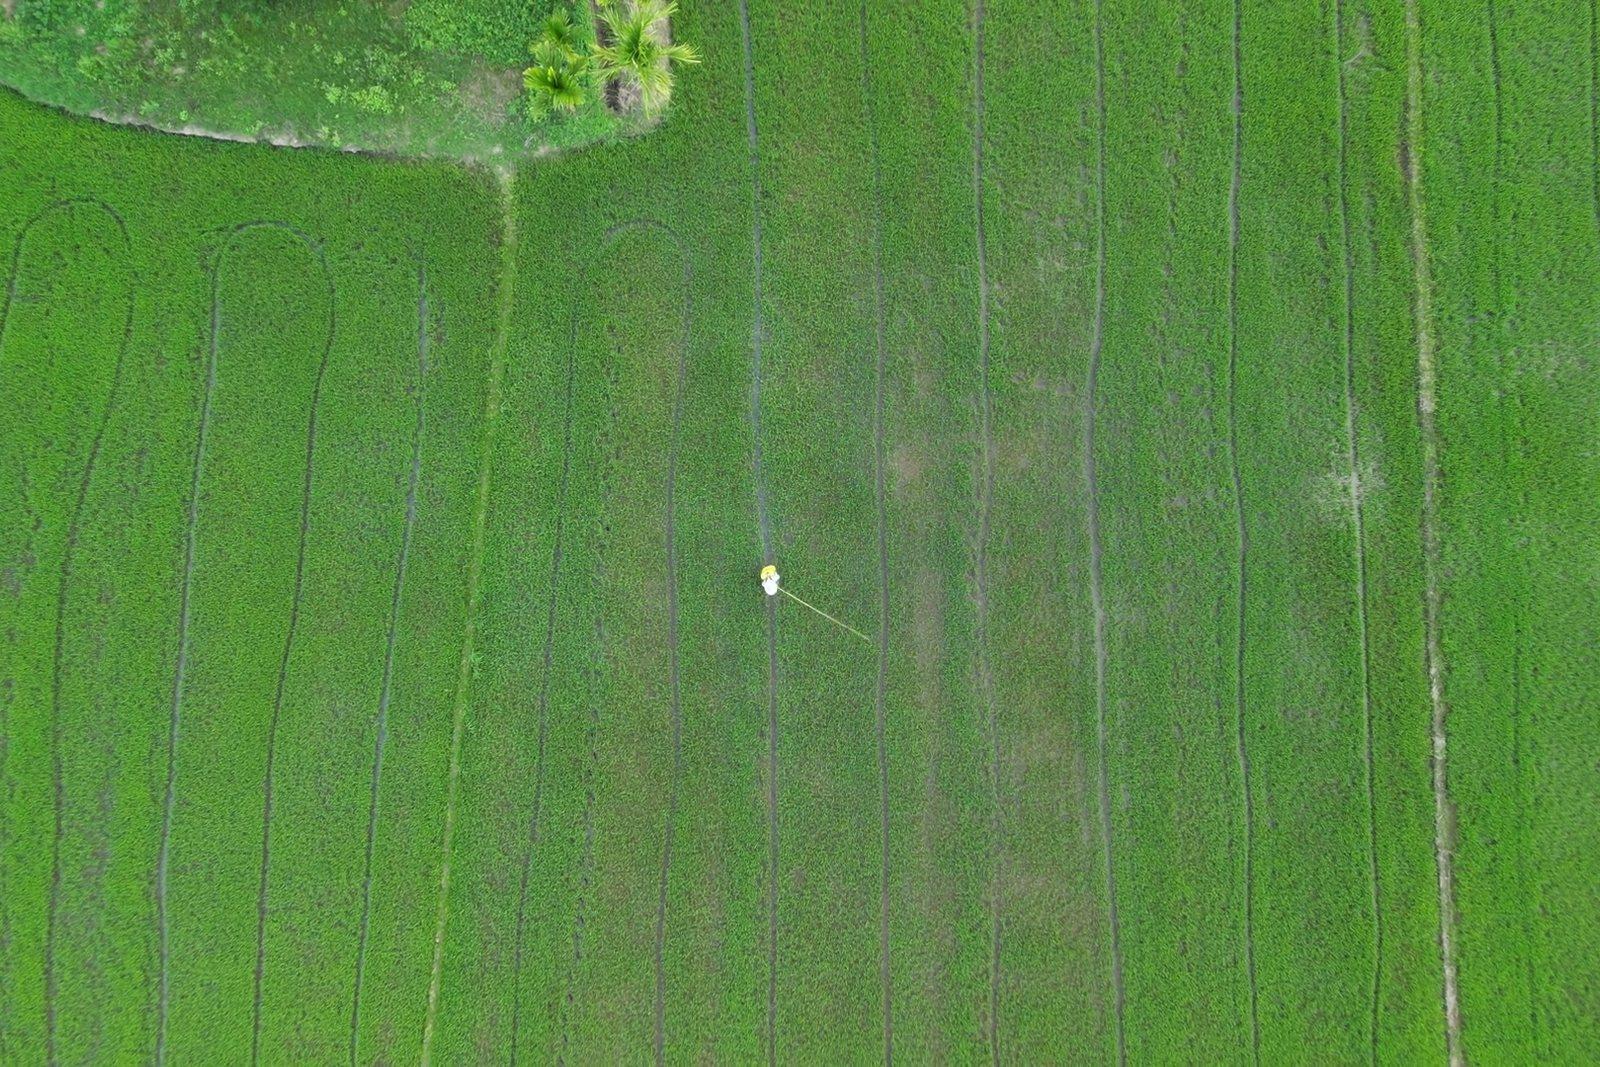
Rows read straight down: at this scale the area is measured on the file, not estimated from the headland.
Gaps, lodging, waterlogging

At one centimetre per pixel the row reads plant by plant. Lodged areas and standing water are outlined as polygons and quantified in hectares, not by eye.

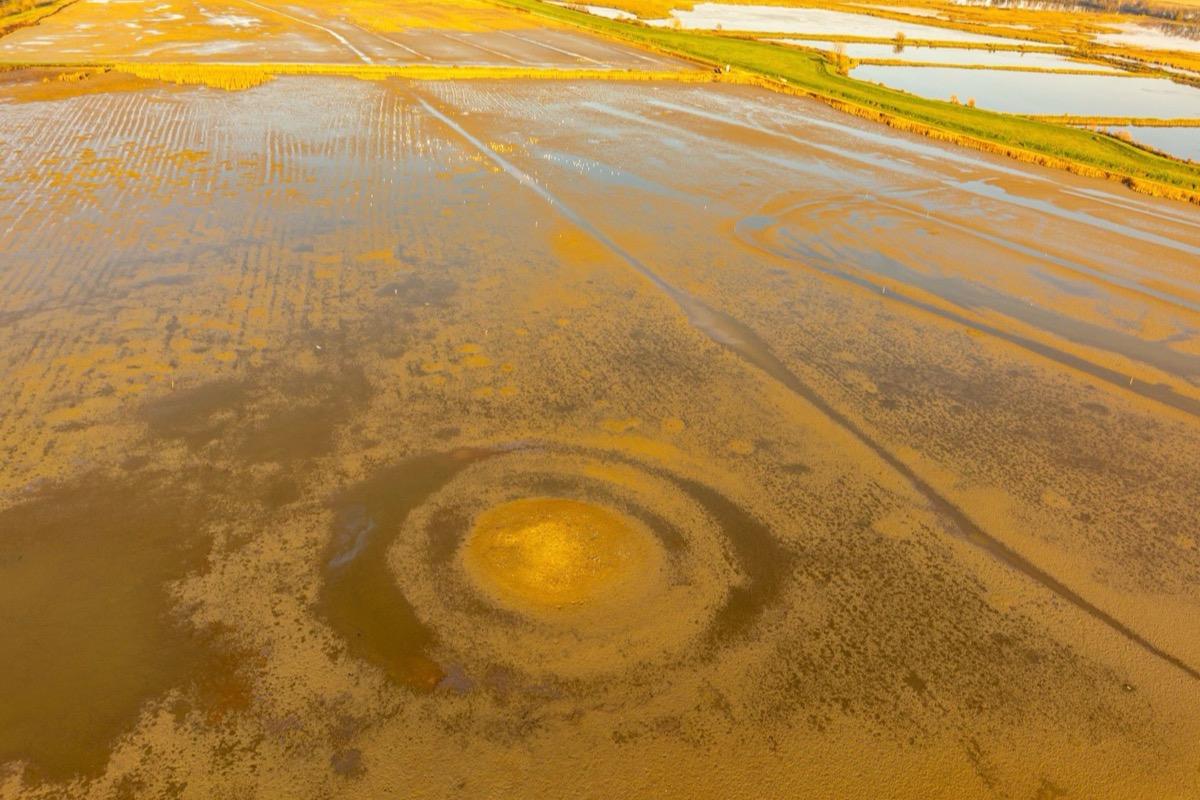
Standing water in the middle of the paddy: invisible from the road, outlined and counted in hectares on the orthophoto.

Water stress and thermal differences

The thermal camera separates temperature differences down to 0.05 °C: a wet surface or a transpiring crop is cooler than the dry soil around it, and the difference shows before any colour change.

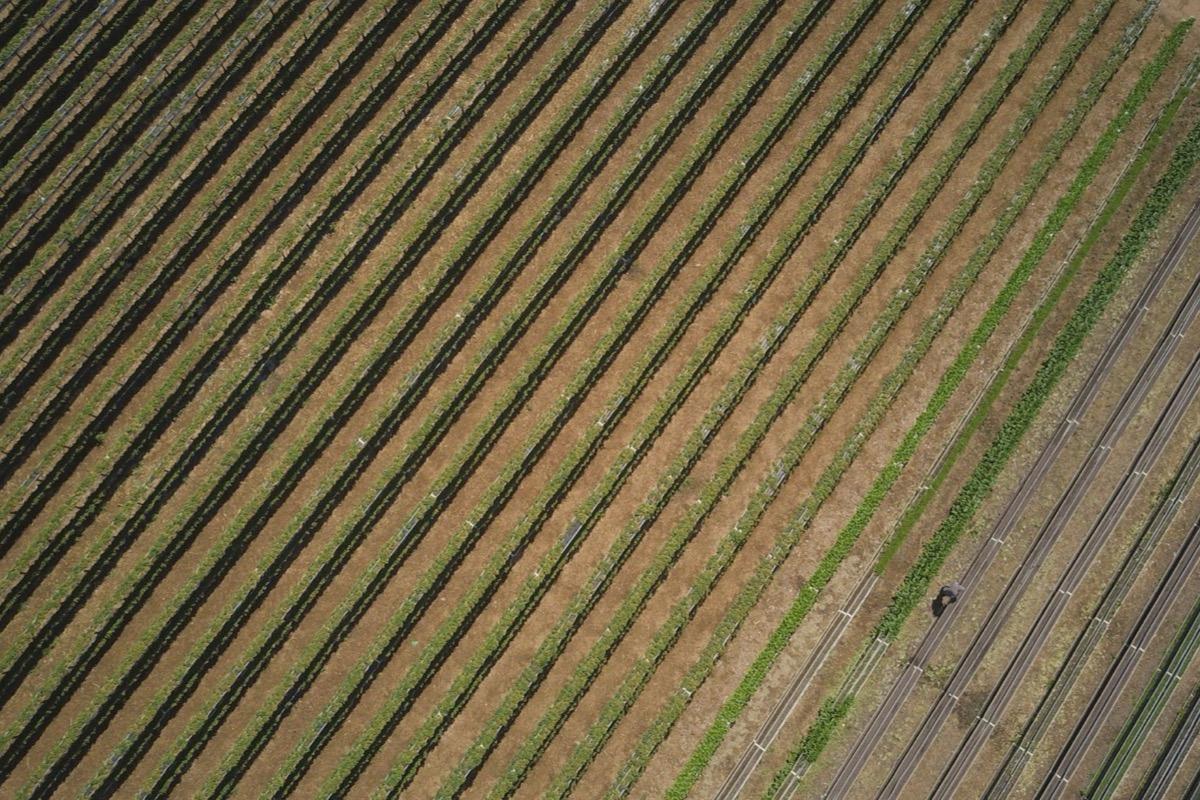
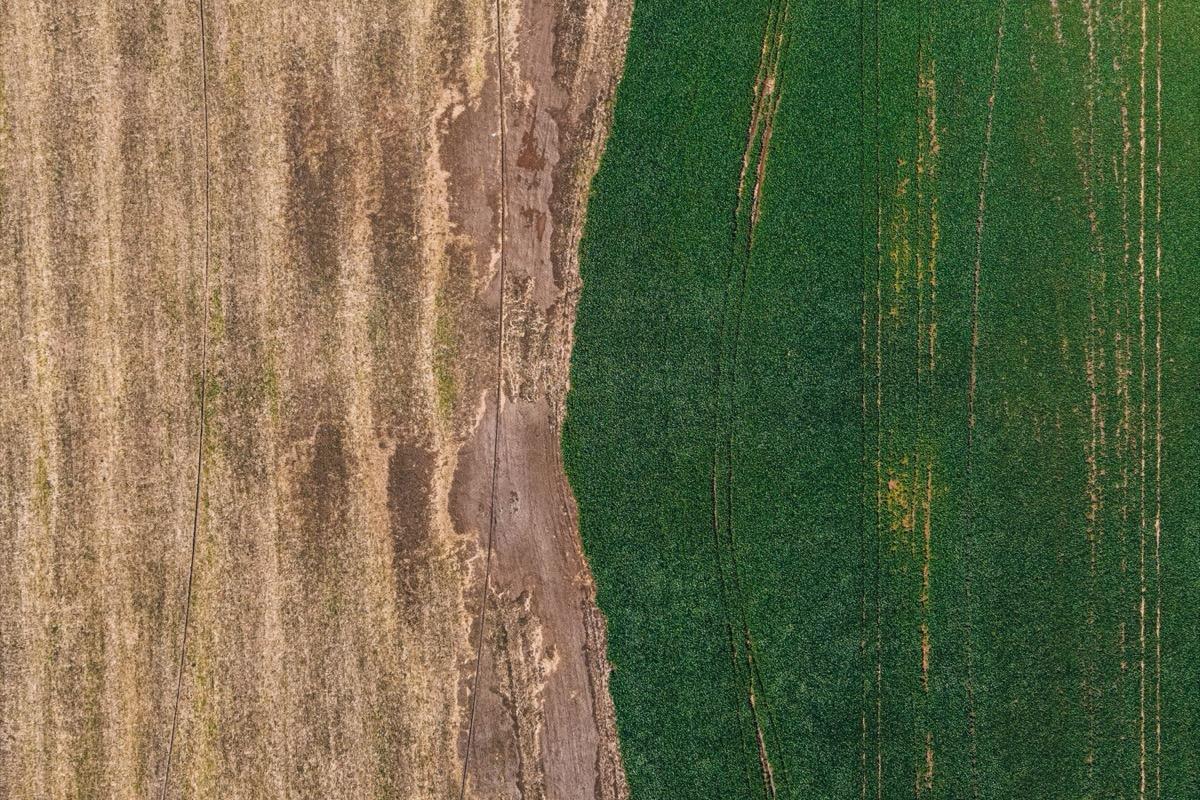
The dry strip against the standing crop: in visible light it shows once the colour has already changed, in thermal before that.

Comparison between two dates

Same route, same altitude, same time of day: two surveys weeks apart become a measurable difference, useful to document how damage develops or what a treatment achieved.

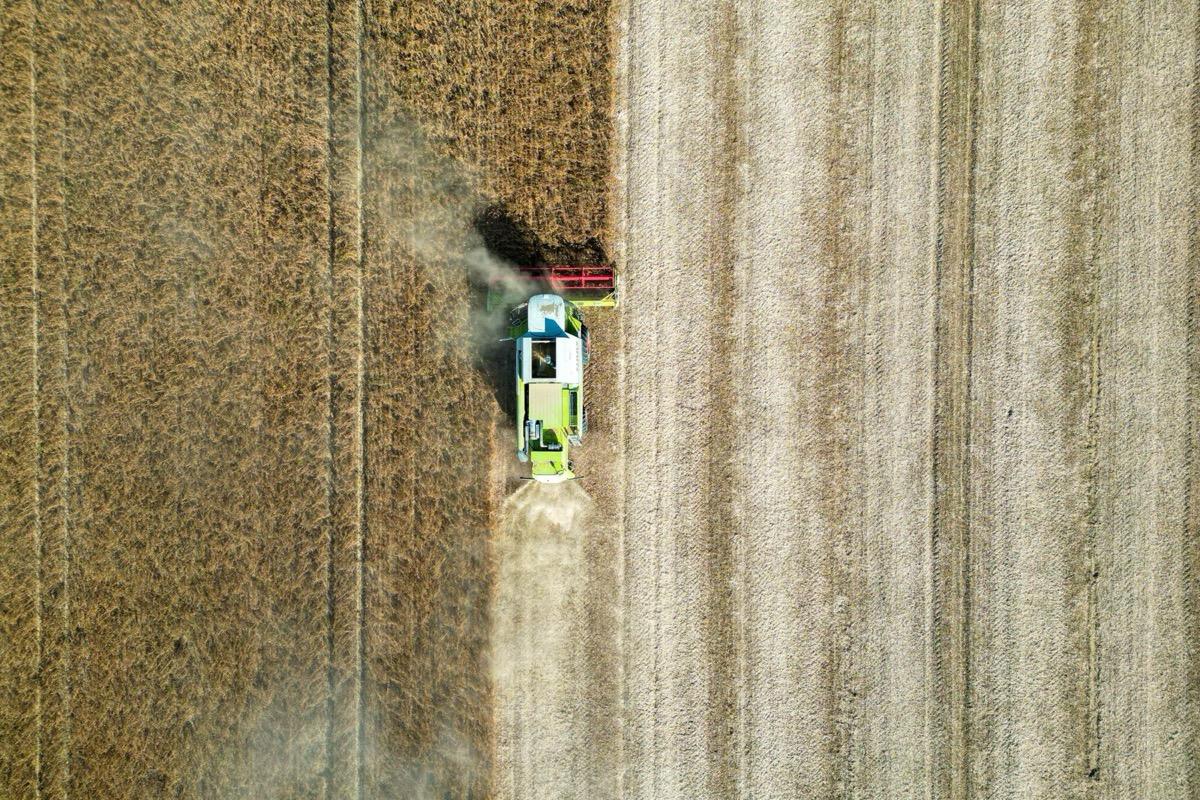
The same plot on harvest day. The value is not the single photo: it is the difference from the one taken three weeks earlier.

Multispectral indices

NDVI and NDRE are computed from near-infrared reflectance, which takes a dedicated sensor to read. The resulting map splits the plot into vigour zones: that is the data an agronomist decides on.

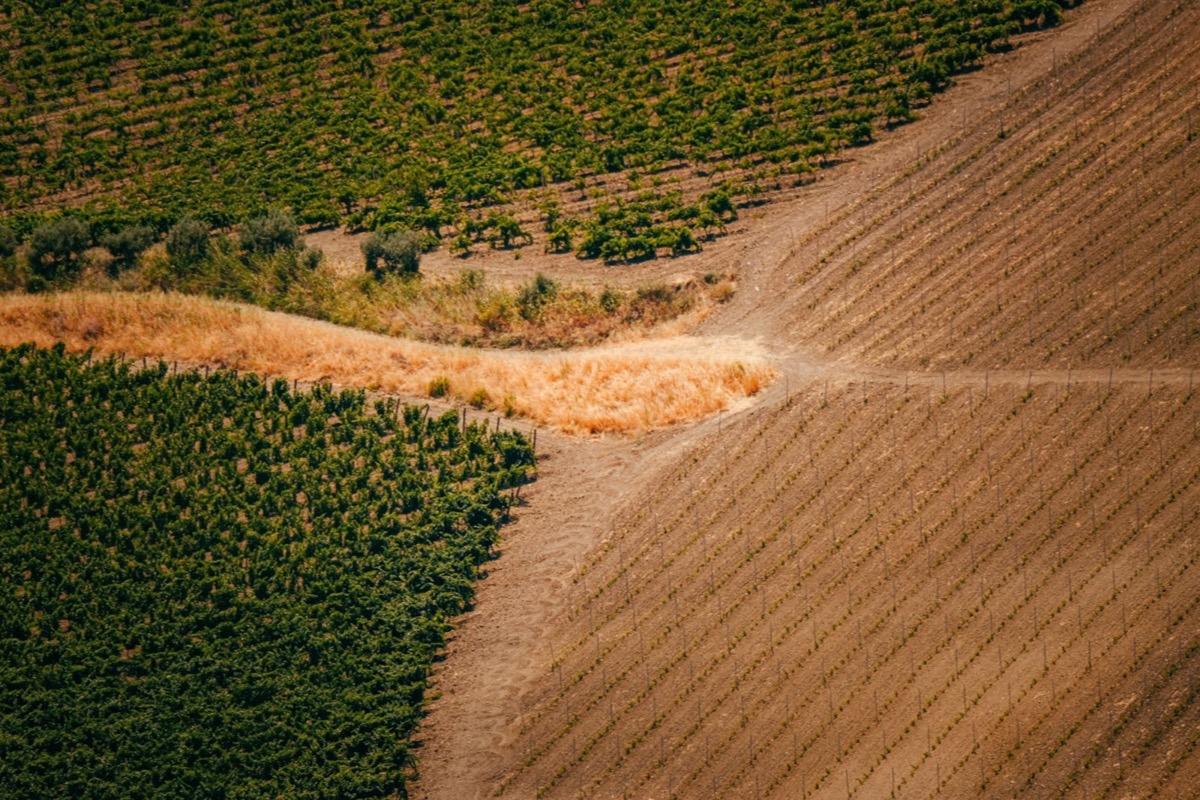
Three adjoining parcels, three different vigour levels. By eye you see the extremes; the index measures what lies between them too.

Map-driven application

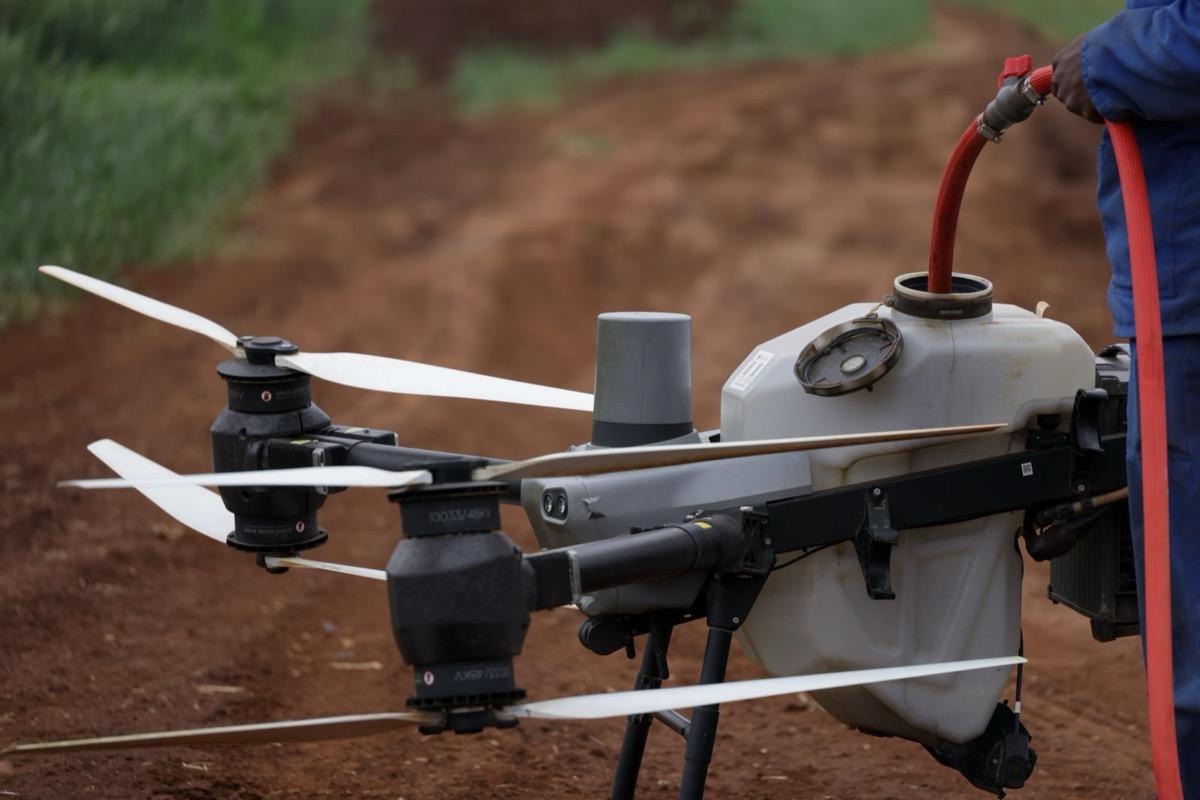
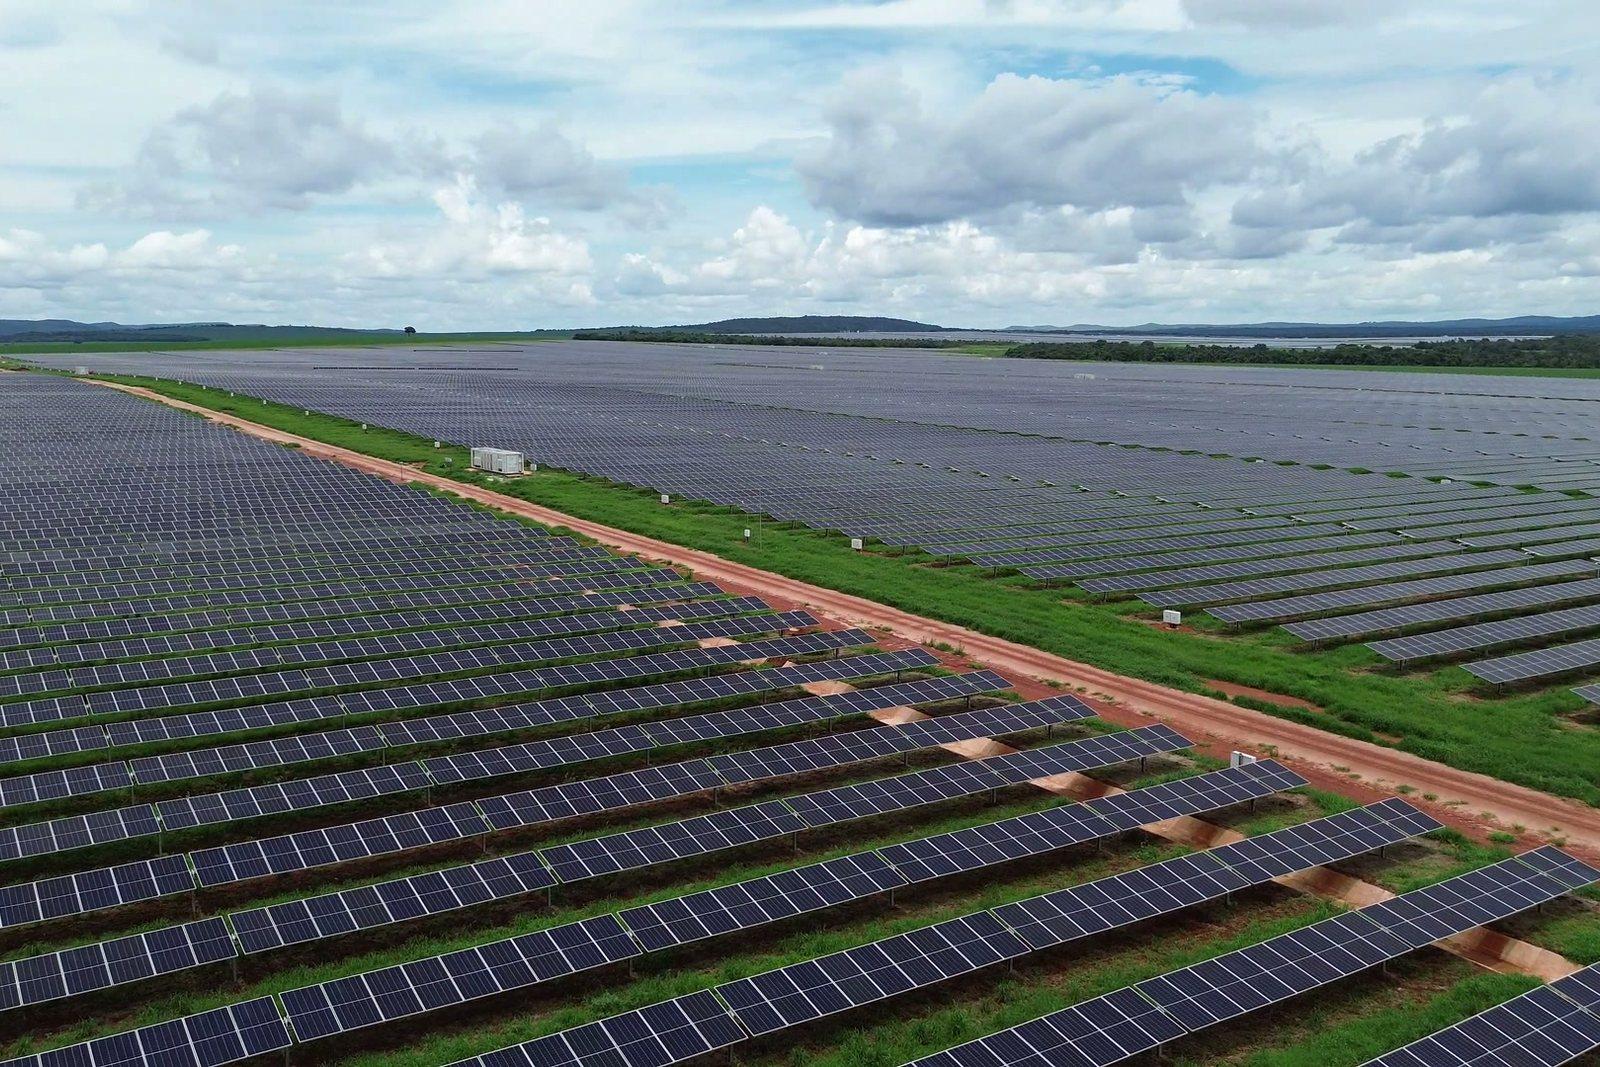
Tanks from 40 to 100 litres and a working width up to 13 metres: material goes where the map says, in the amount it says. For plant protection products the legal limits below apply.

The tank is filled at the field edge: how much goes out and where is decided by the map, not by the previous pass.

What you get

  • Georeferenced orthophoto of the plot (GeoTIFF + JPG)
  • Outlines and areas of the affected zones as shapefile or KML
  • Thermal map with per-pixel temperature where the job requires it
  • Comparison between two dates on the same plot
  • Report with date, time, altitude, overlap and flight conditions

Said up front

For plant protection products the constraint is not the machine, it is the law, and it applies to everyone alike. Since 18 December 2025 Italian law allows drone spraying by derogation and experimentally for three years on agricultural land, with notification to the regional plant health service and a sworn agronomic report; the decree that must set out crops, permitted products and technical methods has not yet been issued. On the flying side the way is open: since August 2026 a simplified procedure authorises large agricultural aircraft too. In plain terms: maps, indices and application of non-pesticide materials are available today; on treatment we work within what the rules currently allow, and we tell you where that limit sits before quoting.

Site visit and quote at no cost

Let's talk about your project.